| Param | Original file | Final file |
|---|---|---|
| Filename | modeM0/AS1T03_275T01_9000004180cztM0_level2_bc.evt | modeM0/AS1T03_275T01_9000004180cztM0_level2_quad_clean.evt |
| Size (bytes) | 2,725,283,520 | 851,829,120 |
| Size | 2.5 GB | 812.4 MB |
| Events in quadrant A | 13,694,192 | 5,579,089 |
| Events in quadrant B | 15,509,963 | 5,639,779 |
| Events in quadrant C | 15,720,831 | 5,310,256 |
| Events in quadrant D | 33,449,663 | 5,078,108 |
| Mode M9 | |||
|---|---|---|---|
| Quadrant | BADHDUFLAG | Total packets | Discarded packets |
| A | 0 | 90 | 0 |
| B | 0 | 90 | 0 |
| C | 0 | 90 | 0 |
| D | 0 | 90 | 0 |
| Mode M0 | |||
|---|---|---|---|
| Quadrant | BADHDUFLAG | Total packets | Discarded packets |
| A | 0 | 128274 | 0 |
| B | 0 | 134962 | 0 |
| C | 0 | 136977 | 0 |
| D | 0 | 195148 | 0 |
| Mode SS | |||
|---|---|---|---|
| Quadrant | BADHDUFLAG | Total packets | Discarded packets |
| A | 0 | 1248 | 0 |
| B | 0 | 1248 | 0 |
| C | 0 | 1248 | 0 |
| D | 0 | 1248 | 0 |
| Quadrant | Total seconds | Saturated seconds | Saturation percentage |
|---|---|---|---|
| A | 61144 | 540 | 0.883161% |
| B | 61144 | 1064 | 1.740154% |
| C | 61144 | 1055 | 1.725435% |
| D | 61144 | 3764 | 6.155960% |
Noise dominated data is calculated using 1-second bins in cleaned event files. If a bin has >2000 counts, and if more than 50% of those come from <1% of pixels, then it is considered to be noise-dominated and hence unusable.
| Quadrant | # 1 sec bins | Bins with >0 counts | Bins with >2000 counts | High rate bins dominated by noise | Noise dominated (total time) | Noise dominated (detector-on time) | Marked lightcurve |
|---|---|---|---|---|---|---|---|
| A | 70298 | 61138 | 0 | 0 | 0.00% | 0.00% |  |
| B | 70298 | 61138 | 29 | 29 | 0.04% | 0.05% |  |
| C | 70298 | 61137 | 3 | 3 | 0.00% | 0.00% |  |
| D | 70298 | 61138 | 982 | 982 | 1.40% | 1.61% |  |
Top three noisy pixels from each quadrant. If the there are fewer than three noisy pixels in the level2.evt file, extra rows are filled as -1
| Pixel properties | Quadrant properties | ||||||
|---|---|---|---|---|---|---|---|
| Quadrant | DetID | PixID | Counts | Sigma | Mean | Median | Sigma |
| A | 13 | 254 | 109799 | 139.89 | 3505 | 3459 | 760.2 |
| A | 13 | 6 | 67924 | 84.8 | 3505 | 3459 | 760.2 |
| A | 6 | 16 | 62308 | 77.41 | 3505 | 3459 | 760.2 |
| B | 10 | 245 | 640273 | 965.38 | 3515 | 3450 | 659.7 |
| B | 5 | 255 | 443196 | 666.63 | 3515 | 3450 | 659.7 |
| B | 5 | 172 | 345954 | 519.21 | 3515 | 3450 | 659.7 |
| C | 3 | 233 | 2648350 | 3370.63 | 3314 | 3317 | 784.7 |
| C | 2 | 114 | 120206 | 148.95 | 3314 | 3317 | 784.7 |
| C | 10 | 22 | 101911 | 125.64 | 3314 | 3317 | 784.7 |
| D | 8 | 195 | 11307762 | 14843.09 | 3317 | 3224 | 761.6 |
| D | 1 | 52 | 7584033 | 9953.76 | 3317 | 3224 | 761.6 |
| D | 12 | 233 | 822480 | 1075.7 | 3317 | 3224 | 761.6 |
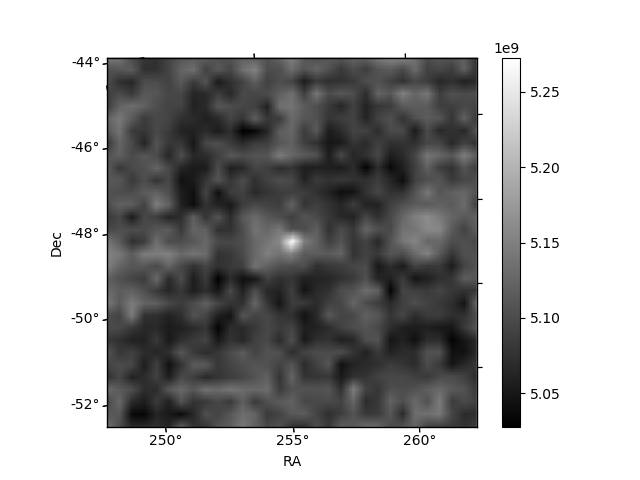
Histogram calculated using DETX and DETY for each event in the final _common_clean file
| Quadrant A |  |
 |
Quadrant B |
|---|---|---|---|
| Quadrant D |  |
 |
Quadrant C |
| Plot type | Count rate plots | Images |
|---|---|---|
| Comparison with Poisson distribution Blue bars denote a histogram of data divided into 1 sec bins. Red curve is a Poisson curve with rate = median count rate of data. |
 |
 |
| Quadrant-wise count rates Data is divided into 100 sec bins |
 |
|
| Module-wise count rates for Quadrant A Data is divided into 100 sec bins |
 |
 |
| Module-wise count rates for Quadrant B Data is divided into 100 sec bins |
 |
 |
| Module-wise count rates for Quadrant C Data is divided into 100 sec bins |
 |
 |
| Module-wise count rates for Quadrant D Data is divided into 100 sec bins |
 |
 |
| Parameter | Plot |
|---|---|
| CZT HV Monitor |  |
| D_VDD |  |
| Temperature 1 |  |
| Veto HV Monitor |  |
| Veto LLD | 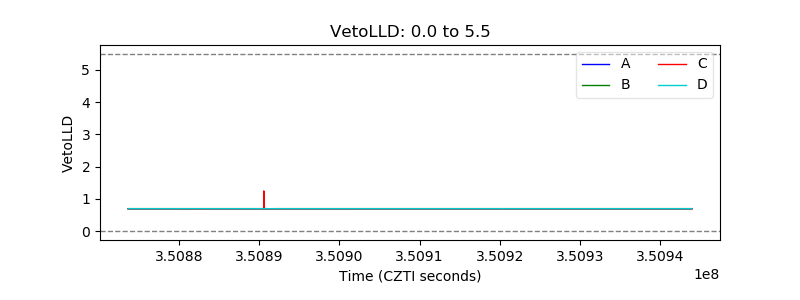 |
| Alpha Counter | 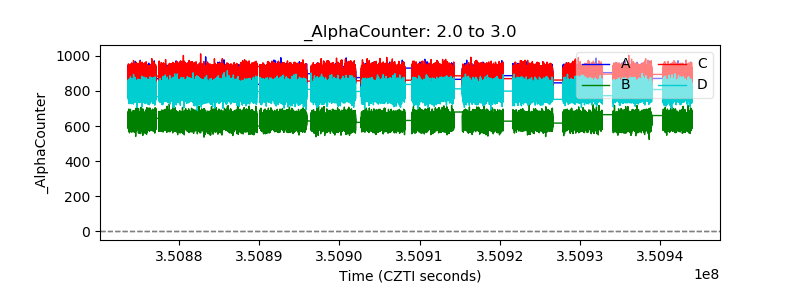 |
| _CPM_Rate |  |
| CZT Counter |  |
| +2.5 Volts monitor |  |
| +5 Volts monitor |  |
| _ROLL_ROT |  |
| _Roll_DEC |  |
| _Roll_RA | 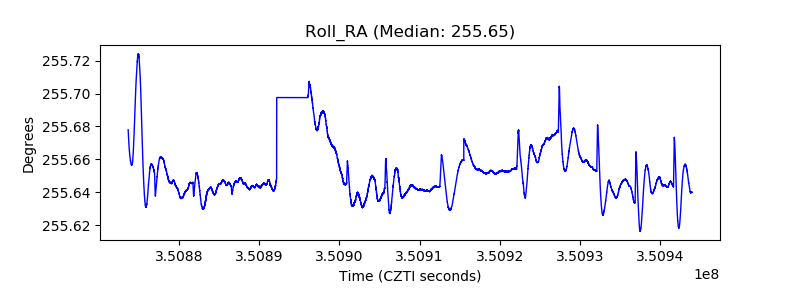 |
| Veto Counter |  |