| Param | Original file | Final file |
|---|---|---|
| Filename | modeM0/AS1A10_063T01_9000004182cztM0_level2_bc.evt | modeM0/AS1A10_063T01_9000004182cztM0_level2_quad_clean.evt |
| Size (bytes) | 5,735,989,440 | 1,642,357,440 |
| Size | 5.3 GB | 1.5 GB |
| Events in quadrant A | 27,788,071 | 10,441,894 |
| Events in quadrant B | 31,061,412 | 10,639,612 |
| Events in quadrant C | 34,114,974 | 10,285,845 |
| Events in quadrant D | 72,193,257 | 9,754,260 |
| Mode M0 | |||
|---|---|---|---|
| Quadrant | BADHDUFLAG | Total packets | Discarded packets |
| A | 0 | 267130 | 0 |
| B | 0 | 279140 | 0 |
| C | 0 | 291900 | 0 |
| D | 0 | 417060 | 0 |
| Mode M9 | |||
|---|---|---|---|
| Quadrant | BADHDUFLAG | Total packets | Discarded packets |
| A | 0 | 172 | 0 |
| B | 0 | 172 | 0 |
| C | 0 | 172 | 0 |
| D | 0 | 172 | 0 |
| Mode SS | |||
|---|---|---|---|
| Quadrant | BADHDUFLAG | Total packets | Discarded packets |
| A | 0 | 2558 | 0 |
| B | 0 | 2558 | 0 |
| C | 0 | 2558 | 0 |
| D | 0 | 2558 | 0 |
| Quadrant | Total seconds | Saturated seconds | Saturation percentage |
|---|---|---|---|
| A | 125835 | 1950 | 1.549648% |
| B | 125834 | 2848 | 2.263299% |
| C | 125835 | 2973 | 2.362618% |
| D | 125834 | 12964 | 10.302462% |
Noise dominated data is calculated using 1-second bins in cleaned event files. If a bin has >2000 counts, and if more than 50% of those come from <1% of pixels, then it is considered to be noise-dominated and hence unusable.
| Quadrant | # 1 sec bins | Bins with >0 counts | Bins with >2000 counts | High rate bins dominated by noise | Noise dominated (total time) | Noise dominated (detector-on time) | Marked lightcurve |
|---|---|---|---|---|---|---|---|
| A | 143169 | 125841 | 114 | 114 | 0.08% | 0.09% |  |
| B | 143170 | 125837 | 129 | 129 | 0.09% | 0.10% |  |
| C | 143170 | 125838 | 0 | 0 | 0.00% | 0.00% |  |
| D | 143170 | 125838 | 3783 | 3783 | 2.64% | 3.01% |  |
Top three noisy pixels from each quadrant. If the there are fewer than three noisy pixels in the level2.evt file, extra rows are filled as -1
| Pixel properties | Quadrant properties | ||||||
|---|---|---|---|---|---|---|---|
| Quadrant | DetID | PixID | Counts | Sigma | Mean | Median | Sigma |
| A | 11 | 29 | 525815 | 352.24 | 6898 | 6785 | 1473.5 |
| A | 6 | 16 | 261944 | 173.16 | 6898 | 6785 | 1473.5 |
| A | 13 | 254 | 207207 | 136.02 | 6898 | 6785 | 1473.5 |
| B | 10 | 245 | 2909718 | 2243.0 | 6964 | 6808 | 1294.2 |
| B | 10 | 246 | 473236 | 360.4 | 6964 | 6808 | 1294.2 |
| B | 0 | 190 | 443852 | 337.69 | 6964 | 6808 | 1294.2 |
| C | 3 | 233 | 7947977 | 5080.04 | 6692 | 6671 | 1563.2 |
| C | 2 | 114 | 245215 | 152.6 | 6692 | 6671 | 1563.2 |
| C | 9 | 54 | 66950 | 38.56 | 6692 | 6671 | 1563.2 |
| D | 1 | 52 | 25084745 | 16890.14 | 6567 | 6366 | 1484.8 |
| D | 8 | 195 | 19887608 | 13389.9 | 6567 | 6366 | 1484.8 |
| D | 12 | 233 | 859084 | 574.3 | 6567 | 6366 | 1484.8 |
Histogram calculated using DETX and DETY for each event in the final _common_clean file
| Quadrant A |  |
 |
Quadrant B |
|---|---|---|---|
| Quadrant D |  |
 |
Quadrant C |
| Plot type | Count rate plots | Images |
|---|---|---|
| Comparison with Poisson distribution Blue bars denote a histogram of data divided into 1 sec bins. Red curve is a Poisson curve with rate = median count rate of data. |
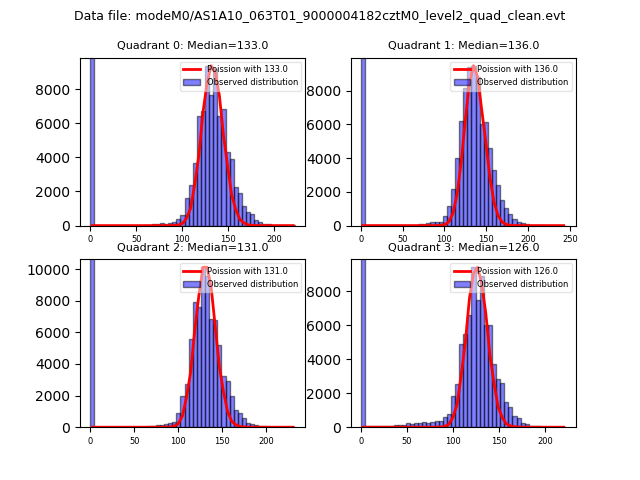 |
 |
| Quadrant-wise count rates Data is divided into 100 sec bins |
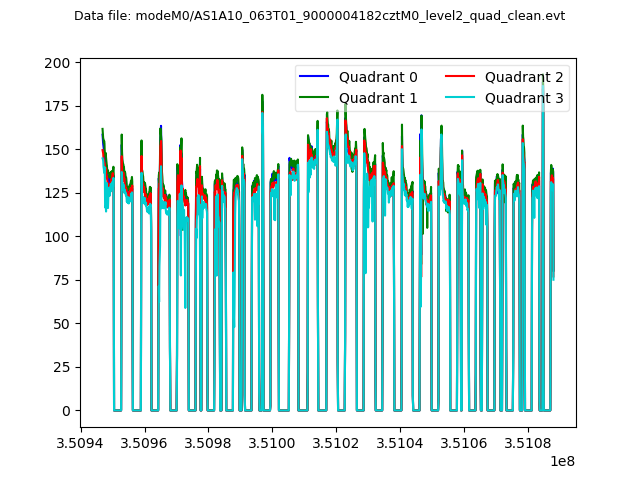 |
|
| Module-wise count rates for Quadrant A Data is divided into 100 sec bins |
 |
 |
| Module-wise count rates for Quadrant B Data is divided into 100 sec bins |
 |
 |
| Module-wise count rates for Quadrant C Data is divided into 100 sec bins |
 |
 |
| Module-wise count rates for Quadrant D Data is divided into 100 sec bins |
 |
 |
| Parameter | Plot |
|---|---|
| CZT HV Monitor |  |
| D_VDD | 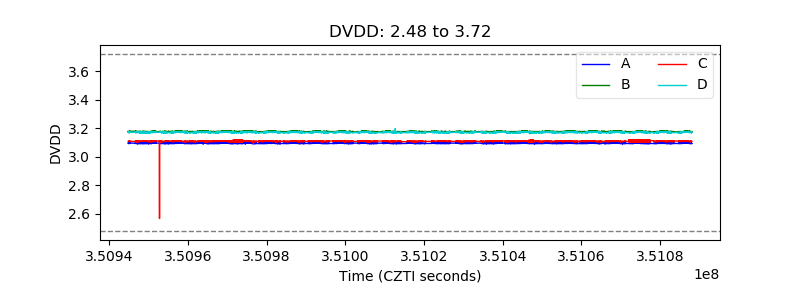 |
| Temperature 1 |  |
| Veto HV Monitor | 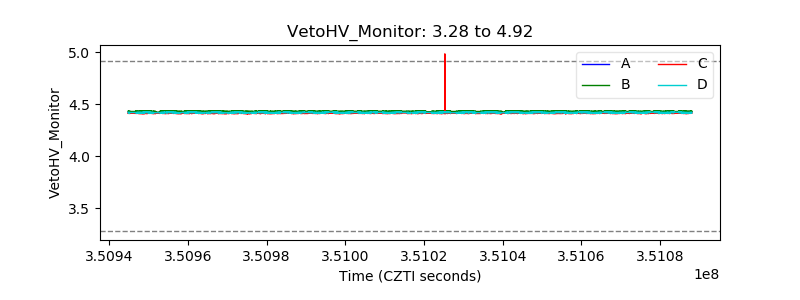 |
| Veto LLD |  |
| Alpha Counter |  |
| _CPM_Rate |  |
| CZT Counter |  |
| +2.5 Volts monitor |  |
| +5 Volts monitor |  |
| _ROLL_ROT |  |
| _Roll_DEC |  |
| _Roll_RA |  |
| Veto Counter |  |