| Param | Original file | Final file |
|---|---|---|
| Filename | modeM0/AS1A10_094T18_9000004174cztM0_level2_bc.evt | modeM0/AS1A10_094T18_9000004174cztM0_level2_quad_clean.evt |
| Size (bytes) | 232,027,200 | 100,370,880 |
| Size | 221.3 MB | 95.7 MB |
| Events in quadrant A | 1,107,962 | 706,574 |
| Events in quadrant B | 1,224,475 | 709,618 |
| Events in quadrant C | 1,042,195 | 660,731 |
| Events in quadrant D | 3,313,908 | 621,684 |
| Mode M0 | |||
|---|---|---|---|
| Quadrant | BADHDUFLAG | Total packets | Discarded packets |
| A | 0 | 10372 | 0 |
| B | 0 | 10773 | 0 |
| C | 0 | 10230 | 0 |
| D | 0 | 17744 | 0 |
| Mode M9 | |||
|---|---|---|---|
| Quadrant | BADHDUFLAG | Total packets | Discarded packets |
| A | 0 | 11 | 0 |
| B | 0 | 11 | 0 |
| C | 0 | 11 | 0 |
| D | 0 | 11 | 0 |
| Mode SS | |||
|---|---|---|---|
| Quadrant | BADHDUFLAG | Total packets | Discarded packets |
| A | 0 | 100 | 0 |
| B | 0 | 100 | 0 |
| C | 0 | 100 | 0 |
| D | 0 | 100 | 0 |
| Quadrant | Total seconds | Saturated seconds | Saturation percentage |
|---|---|---|---|
| A | 4859 | 48 | 0.987858% |
| B | 4859 | 84 | 1.728751% |
| C | 4859 | 66 | 1.358304% |
| D | 4859 | 449 | 9.240584% |
Noise dominated data is calculated using 1-second bins in cleaned event files. If a bin has >2000 counts, and if more than 50% of those come from <1% of pixels, then it is considered to be noise-dominated and hence unusable.
| Quadrant | # 1 sec bins | Bins with >0 counts | Bins with >2000 counts | High rate bins dominated by noise | Noise dominated (total time) | Noise dominated (detector-on time) | Marked lightcurve |
|---|---|---|---|---|---|---|---|
| A | 5979 | 4857 | 0 | 0 | 0.00% | 0.00% |  |
| B | 5979 | 4857 | 1 | 1 | 0.02% | 0.02% |  |
| C | 5980 | 4858 | 0 | 0 | 0.00% | 0.00% |  |
| D | 5980 | 4859 | 99 | 99 | 1.66% | 2.04% |  |
Top three noisy pixels from each quadrant. If the there are fewer than three noisy pixels in the level2.evt file, extra rows are filled as -1
| Pixel properties | Quadrant properties | ||||||
|---|---|---|---|---|---|---|---|
| Quadrant | DetID | PixID | Counts | Sigma | Mean | Median | Sigma |
| A | 13 | 254 | 9246 | 142.37 | 283 | 278 | 63.0 |
| A | 15 | 174 | 5871 | 88.79 | 283 | 278 | 63.0 |
| A | 13 | 6 | 5364 | 80.74 | 283 | 278 | 63.0 |
| B | 5 | 255 | 32171 | 575.87 | 283 | 278 | 55.4 |
| B | 10 | 246 | 28785 | 514.73 | 283 | 278 | 55.4 |
| B | 0 | 182 | 20840 | 371.27 | 283 | 278 | 55.4 |
| C | 2 | 16 | 18188 | 279.9 | 263 | 263 | 64.0 |
| C | 2 | 114 | 9796 | 148.86 | 263 | 263 | 64.0 |
| C | 3 | 233 | 2791 | 39.47 | 263 | 263 | 64.0 |
| D | 1 | 52 | 832829 | 13385.51 | 261 | 252 | 62.2 |
| D | 8 | 195 | 622651 | 10006.43 | 261 | 252 | 62.2 |
| D | 7 | 80 | 427823 | 6874.15 | 261 | 252 | 62.2 |
Histogram calculated using DETX and DETY for each event in the final _common_clean file
| Quadrant A | 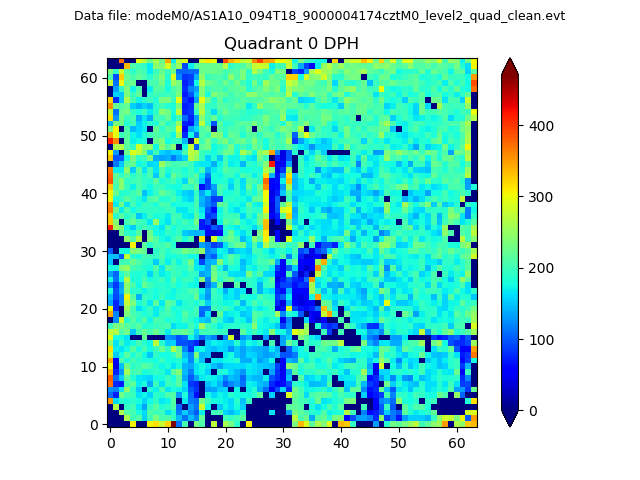 |
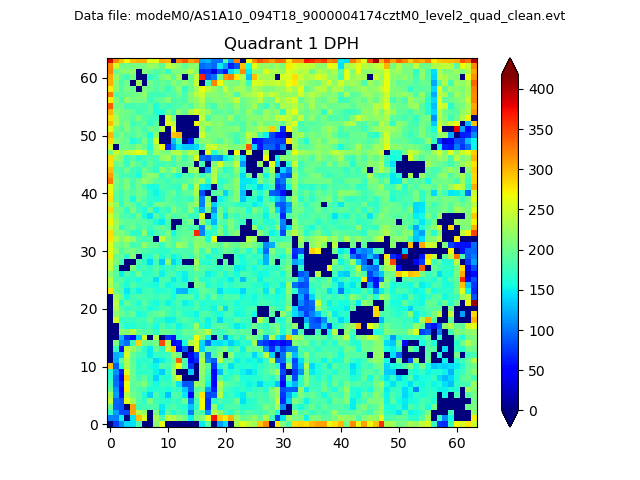 |
Quadrant B |
|---|---|---|---|
| Quadrant D |  |
 |
Quadrant C |
| Plot type | Count rate plots | Images |
|---|---|---|
| Comparison with Poisson distribution Blue bars denote a histogram of data divided into 1 sec bins. Red curve is a Poisson curve with rate = median count rate of data. |
 |
 |
| Quadrant-wise count rates Data is divided into 100 sec bins |
 |
|
| Module-wise count rates for Quadrant A Data is divided into 100 sec bins |
 |
 |
| Module-wise count rates for Quadrant B Data is divided into 100 sec bins |
 |
 |
| Module-wise count rates for Quadrant C Data is divided into 100 sec bins |
 |
 |
| Module-wise count rates for Quadrant D Data is divided into 100 sec bins |
 |
 |
| Parameter | Plot |
|---|---|
| CZT HV Monitor |  |
| D_VDD |  |
| Temperature 1 |  |
| Veto HV Monitor |  |
| Veto LLD | 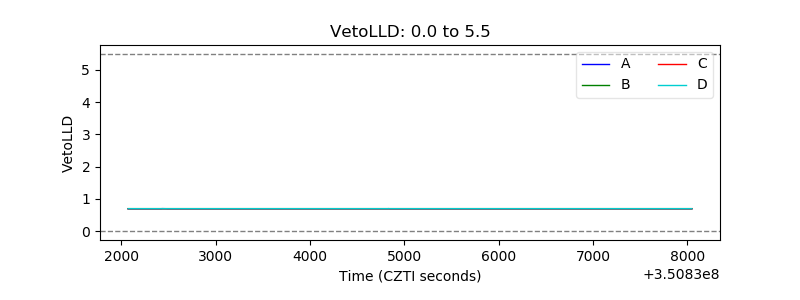 |
| Alpha Counter |  |
| _CPM_Rate |  |
| CZT Counter |  |
| +2.5 Volts monitor |  |
| +5 Volts monitor |  |
| _ROLL_ROT |  |
| _Roll_DEC |  |
| _Roll_RA |  |
| Veto Counter |  |