| Param | Original file | Final file |
|---|---|---|
| Filename | modeM0/AS1A10_094T17_9000004176cztM0_level2_bc.evt | modeM0/AS1A10_094T17_9000004176cztM0_level2_quad_clean.evt |
| Size (bytes) | 233,735,040 | 81,357,120 |
| Size | 222.9 MB | 77.6 MB |
| Events in quadrant A | 924,879 | 587,851 |
| Events in quadrant B | 1,046,752 | 592,132 |
| Events in quadrant C | 864,108 | 544,568 |
| Events in quadrant D | 3,977,369 | 471,248 |
| Mode SS | |||
|---|---|---|---|
| Quadrant | BADHDUFLAG | Total packets | Discarded packets |
| A | 0 | 78 | 0 |
| B | 0 | 78 | 0 |
| C | 0 | 78 | 0 |
| D | 0 | 78 | 0 |
| Mode M0 | |||
|---|---|---|---|
| Quadrant | BADHDUFLAG | Total packets | Discarded packets |
| A | 0 | 8272 | 0 |
| B | 0 | 8725 | 0 |
| C | 0 | 8168 | 0 |
| D | 0 | 18719 | 0 |
| Mode M9 | |||
|---|---|---|---|
| Quadrant | BADHDUFLAG | Total packets | Discarded packets |
| A | 0 | 12 | 0 |
| B | 0 | 12 | 0 |
| C | 0 | 12 | 0 |
| D | 0 | 12 | 0 |
| Quadrant | Total seconds | Saturated seconds | Saturation percentage |
|---|---|---|---|
| A | 3790 | 66 | 1.741425% |
| B | 3790 | 93 | 2.453826% |
| C | 3790 | 78 | 2.058047% |
| D | 3790 | 1007 | 26.569921% |
Noise dominated data is calculated using 1-second bins in cleaned event files. If a bin has >2000 counts, and if more than 50% of those come from <1% of pixels, then it is considered to be noise-dominated and hence unusable.
| Quadrant | # 1 sec bins | Bins with >0 counts | Bins with >2000 counts | High rate bins dominated by noise | Noise dominated (total time) | Noise dominated (detector-on time) | Marked lightcurve |
|---|---|---|---|---|---|---|---|
| A | 4980 | 3789 | 0 | 0 | 0.00% | 0.00% |  |
| B | 4980 | 3789 | 1 | 1 | 0.02% | 0.03% |  |
| C | 4979 | 3788 | 0 | 0 | 0.00% | 0.00% |  |
| D | 4979 | 3788 | 453 | 453 | 9.10% | 11.96% |  |
Top three noisy pixels from each quadrant. If the there are fewer than three noisy pixels in the level2.evt file, extra rows are filled as -1
| Pixel properties | Quadrant properties | ||||||
|---|---|---|---|---|---|---|---|
| Quadrant | DetID | PixID | Counts | Sigma | Mean | Median | Sigma |
| A | 13 | 254 | 7024 | 127.31 | 237 | 233 | 53.3 |
| A | 6 | 16 | 5210 | 93.3 | 237 | 233 | 53.3 |
| A | 13 | 6 | 3880 | 68.37 | 237 | 233 | 53.3 |
| B | 5 | 172 | 49067 | 1050.67 | 236 | 232 | 46.5 |
| B | 5 | 255 | 31419 | 670.98 | 236 | 232 | 46.5 |
| B | 3 | 209 | 12646 | 267.08 | 236 | 232 | 46.5 |
| C | 2 | 16 | 16878 | 310.54 | 217 | 216 | 53.7 |
| C | 2 | 114 | 7798 | 141.31 | 217 | 216 | 53.7 |
| C | 7 | 247 | 1984 | 32.95 | 217 | 216 | 53.7 |
| D | 1 | 52 | 2248623 | 46554.57 | 202 | 195 | 48.3 |
| D | 8 | 195 | 583242 | 12072.21 | 202 | 195 | 48.3 |
| D | 7 | 69 | 191801 | 3967.28 | 202 | 195 | 48.3 |
Histogram calculated using DETX and DETY for each event in the final _common_clean file
| Quadrant A | 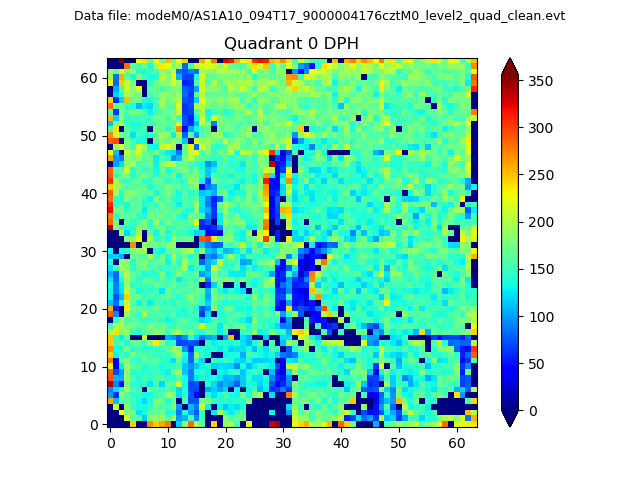 |
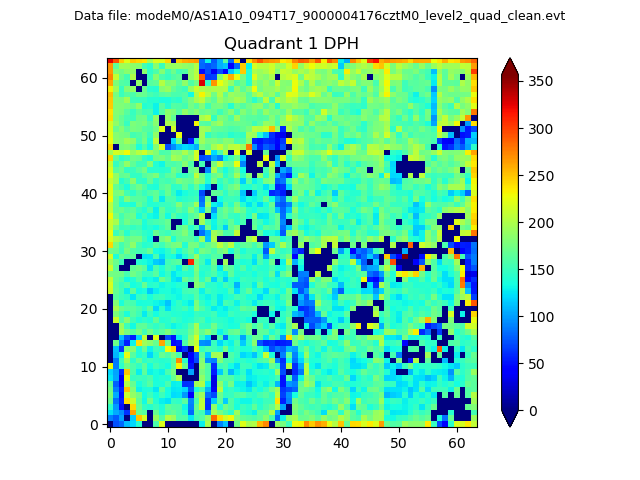 |
Quadrant B |
|---|---|---|---|
| Quadrant D |  |
 |
Quadrant C |
| Plot type | Count rate plots | Images |
|---|---|---|
| Comparison with Poisson distribution Blue bars denote a histogram of data divided into 1 sec bins. Red curve is a Poisson curve with rate = median count rate of data. |
 |
 |
| Quadrant-wise count rates Data is divided into 100 sec bins |
 |
|
| Module-wise count rates for Quadrant A Data is divided into 100 sec bins |
 |
 |
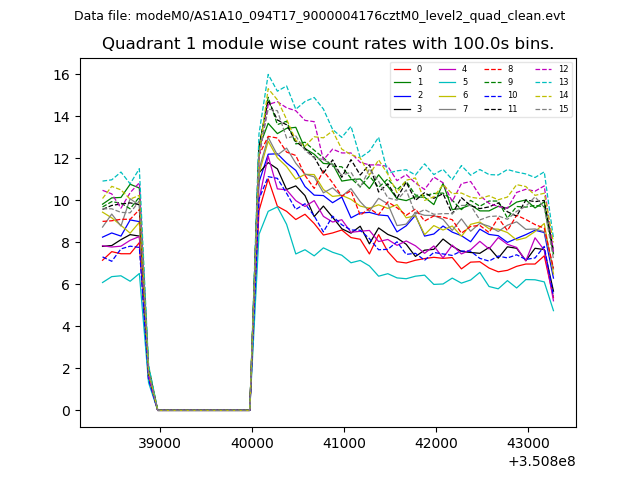
| Module-wise count rates for Quadrant B Data is divided into 100 sec bins |
 |
 |
| Module-wise count rates for Quadrant C Data is divided into 100 sec bins |
 |
 |
| Module-wise count rates for Quadrant D Data is divided into 100 sec bins |
 |
 |
| Parameter | Plot |
|---|---|
| CZT HV Monitor |  |
| D_VDD |  |
| Temperature 1 |  |
| Veto HV Monitor | 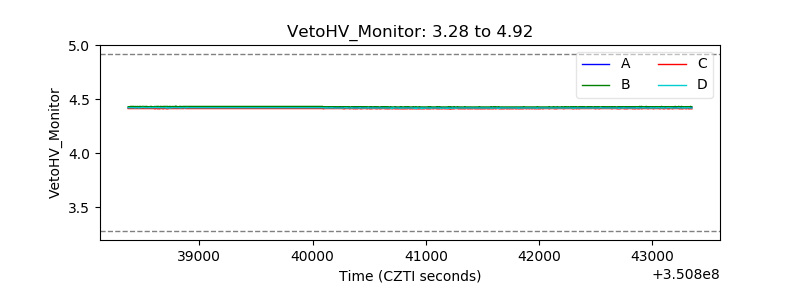 |
| Veto LLD |  |
| Alpha Counter |  |
| _CPM_Rate |  |
| CZT Counter |  |
| +2.5 Volts monitor |  |
| +5 Volts monitor | 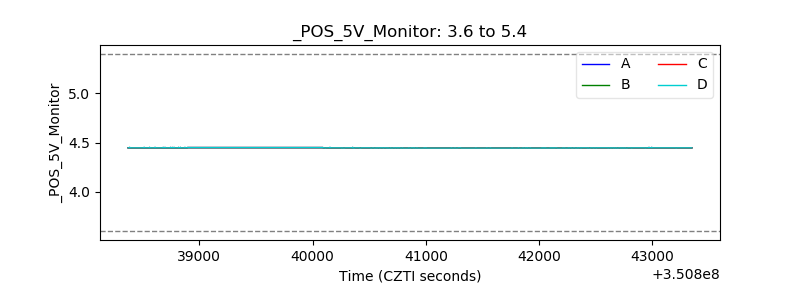 |
| _ROLL_ROT |  |
| _Roll_DEC | 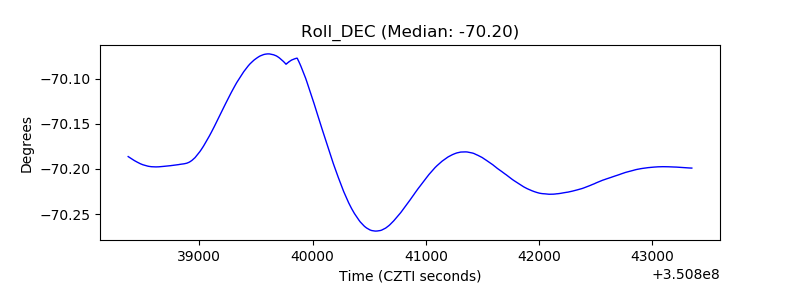 |
| _Roll_RA |  |
| Veto Counter |  |