| Param | Original file | Final file |
|---|---|---|
| Filename | modeM0/AS1A10_094T22_9000004168cztM0_level2_bc.evt | modeM0/AS1A10_094T22_9000004168cztM0_level2_quad_clean.evt |
| Size (bytes) | 94,417,920 | 38,643,840 |
| Size | 90.0 MB | 36.9 MB |
| Events in quadrant A | 480,578 | 265,255 |
| Events in quadrant B | 495,361 | 269,296 |
| Events in quadrant C | 452,117 | 252,036 |
| Events in quadrant D | 1,287,504 | 238,441 |
| Mode M0 | |||
|---|---|---|---|
| Quadrant | BADHDUFLAG | Total packets | Discarded packets |
| A | 0 | 4543 | 0 |
| B | 0 | 4554 | 0 |
| C | 0 | 4466 | 0 |
| D | 0 | 7447 | 0 |
| Mode SS | |||
|---|---|---|---|
| Quadrant | BADHDUFLAG | Total packets | Discarded packets |
| A | 0 | 40 | 0 |
| B | 0 | 40 | 0 |
| C | 0 | 40 | 0 |
| D | 0 | 40 | 0 |
| Mode M9 | |||
|---|---|---|---|
| Quadrant | BADHDUFLAG | Total packets | Discarded packets |
| A | 0 | 11 | 0 |
| B | 0 | 11 | 0 |
| C | 0 | 11 | 0 |
| D | 0 | 11 | 0 |
| Quadrant | Total seconds | Saturated seconds | Saturation percentage |
|---|---|---|---|
| A | 1999 | 52 | 2.601301% |
| B | 1999 | 55 | 2.751376% |
| C | 1999 | 64 | 3.201601% |
| D | 1999 | 210 | 10.505253% |
Noise dominated data is calculated using 1-second bins in cleaned event files. If a bin has >2000 counts, and if more than 50% of those come from <1% of pixels, then it is considered to be noise-dominated and hence unusable.
| Quadrant | # 1 sec bins | Bins with >0 counts | Bins with >2000 counts | High rate bins dominated by noise | Noise dominated (total time) | Noise dominated (detector-on time) | Marked lightcurve |
|---|---|---|---|---|---|---|---|
| A | 3058 | 1997 | 0 | 0 | 0.00% | 0.00% |  |
| B | 3058 | 1997 | 0 | 0 | 0.00% | 0.00% |  |
| C | 3058 | 1997 | 0 | 0 | 0.00% | 0.00% |  |
| D | 3058 | 1997 | 14 | 14 | 0.46% | 0.70% |  |
Top three noisy pixels from each quadrant. If the there are fewer than three noisy pixels in the level2.evt file, extra rows are filled as -1
| Pixel properties | Quadrant properties | ||||||
|---|---|---|---|---|---|---|---|
| Quadrant | DetID | PixID | Counts | Sigma | Mean | Median | Sigma |
| A | 13 | 254 | 3627 | 124.15 | 123 | 121 | 28.2 |
| A | 6 | 16 | 2306 | 77.38 | 123 | 121 | 28.2 |
| A | 13 | 6 | 2214 | 74.12 | 123 | 121 | 28.2 |
| B | 10 | 246 | 8412 | 322.85 | 124 | 120 | 25.7 |
| B | 3 | 209 | 5794 | 220.92 | 124 | 120 | 25.7 |
| B | 5 | 255 | 2065 | 75.73 | 124 | 120 | 25.7 |
| C | 2 | 114 | 4114 | 137.09 | 115 | 114 | 29.2 |
| C | 0 | 207 | 1037 | 31.63 | 115 | 114 | 29.2 |
| C | 3 | 233 | 827 | 24.44 | 115 | 114 | 29.2 |
| D | 1 | 52 | 422159 | 15205.63 | 115 | 110 | 27.8 |
| D | 8 | 195 | 236570 | 8519.21 | 115 | 110 | 27.8 |
| D | 12 | 233 | 165874 | 5972.16 | 115 | 110 | 27.8 |
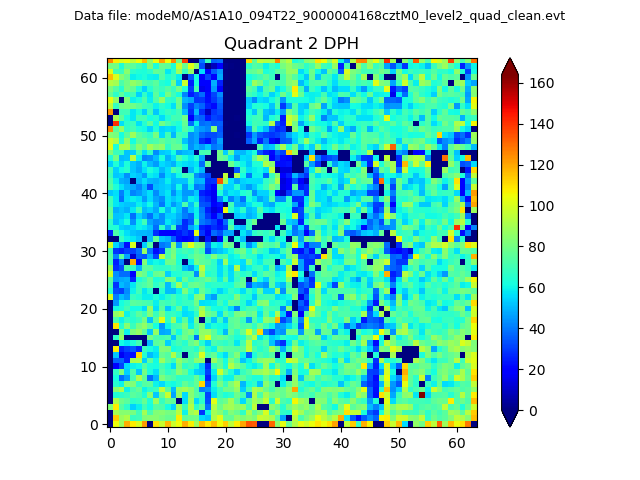
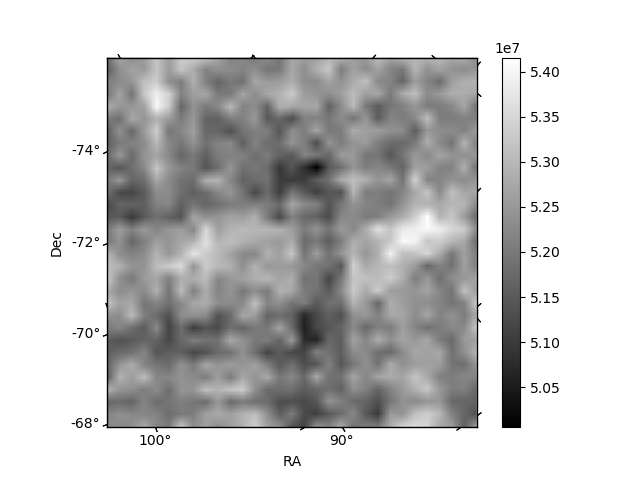
Histogram calculated using DETX and DETY for each event in the final _common_clean file
| Quadrant A |  |
 |
Quadrant B |
|---|---|---|---|
| Quadrant D | 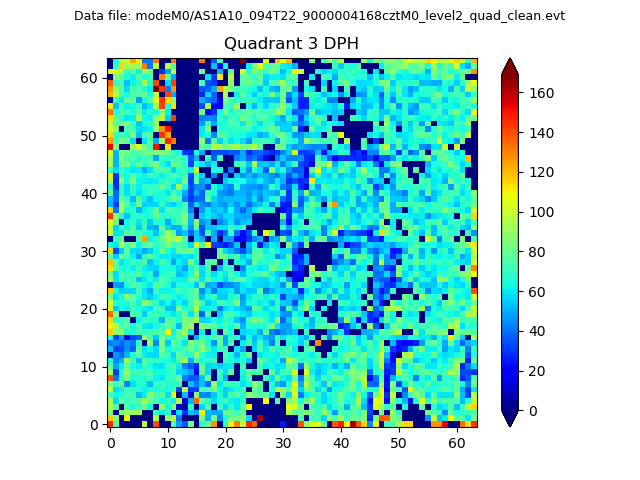 |
 |
Quadrant C |
| Plot type | Count rate plots | Images |
|---|---|---|
| Comparison with Poisson distribution Blue bars denote a histogram of data divided into 1 sec bins. Red curve is a Poisson curve with rate = median count rate of data. |
 |
 |
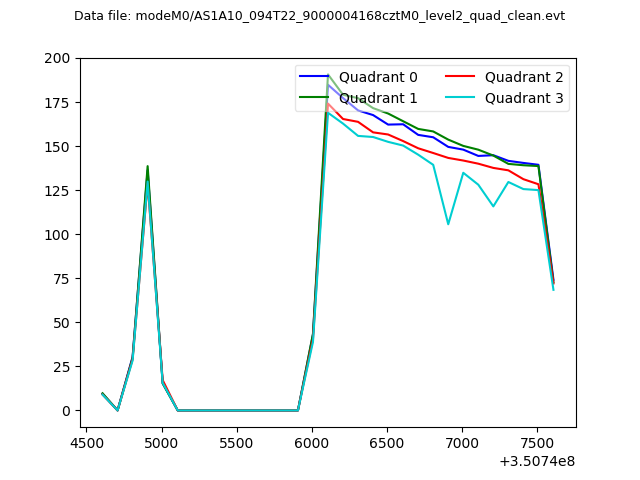
| Quadrant-wise count rates Data is divided into 100 sec bins |
 |
|
| Module-wise count rates for Quadrant A Data is divided into 100 sec bins |
 |
 |
| Module-wise count rates for Quadrant B Data is divided into 100 sec bins |
 |
 |
| Module-wise count rates for Quadrant C Data is divided into 100 sec bins |
 |
 |
| Module-wise count rates for Quadrant D Data is divided into 100 sec bins |
 |
 |
| Parameter | Plot |
|---|---|
| CZT HV Monitor |  |
| D_VDD |  |
| Temperature 1 |  |
| Veto HV Monitor | 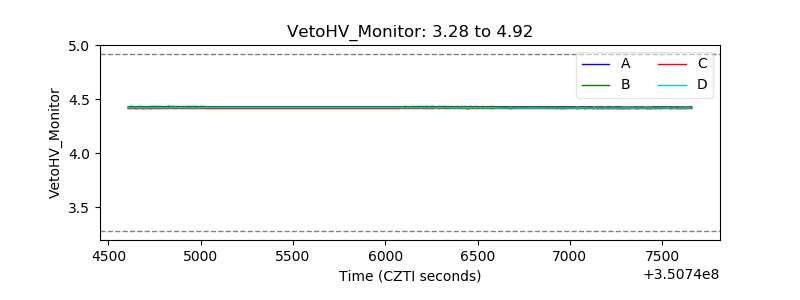 |
| Veto LLD |  |
| Alpha Counter |  |
| _CPM_Rate |  |
| CZT Counter |  |
| +2.5 Volts monitor |  |
| +5 Volts monitor |  |
| _ROLL_ROT |  |
| _Roll_DEC | 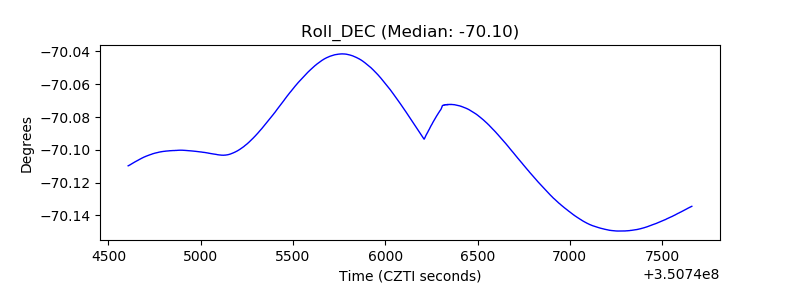 |
| _Roll_RA |  |
| Veto Counter |  |