| Param | Original file | Final file |
|---|---|---|
| Filename | modeM0/AS1A10_094T21_9000004166cztM0_level2_bc.evt | modeM0/AS1A10_094T21_9000004166cztM0_level2_quad_clean.evt |
| Size (bytes) | 219,067,200 | 87,480,000 |
| Size | 208.9 MB | 83.4 MB |
| Events in quadrant A | 1,698,951 | 593,737 |
| Events in quadrant B | 966,811 | 606,416 |
| Events in quadrant C | 895,388 | 576,841 |
| Events in quadrant D | 2,757,576 | 553,839 |
| Mode M9 | |||
|---|---|---|---|
| Quadrant | BADHDUFLAG | Total packets | Discarded packets |
| A | 0 | 4 | 0 |
| B | 0 | 4 | 0 |
| C | 0 | 4 | 0 |
| D | 0 | 4 | 0 |
| Mode M0 | |||
|---|---|---|---|
| Quadrant | BADHDUFLAG | Total packets | Discarded packets |
| A | 0 | 11453 | 0 |
| B | 0 | 9361 | 0 |
| C | 0 | 9307 | 0 |
| D | 0 | 15144 | 0 |
| Mode SS | |||
|---|---|---|---|
| Quadrant | BADHDUFLAG | Total packets | Discarded packets |
| A | 0 | 92 | 0 |
| B | 0 | 92 | 0 |
| C | 0 | 92 | 0 |
| D | 0 | 92 | 0 |
| Quadrant | Total seconds | Saturated seconds | Saturation percentage |
|---|---|---|---|
| A | 4525 | 68 | 1.502762% |
| B | 4525 | 15 | 0.331492% |
| C | 4525 | 26 | 0.574586% |
| D | 4525 | 159 | 3.513812% |
Noise dominated data is calculated using 1-second bins in cleaned event files. If a bin has >2000 counts, and if more than 50% of those come from <1% of pixels, then it is considered to be noise-dominated and hence unusable.
| Quadrant | # 1 sec bins | Bins with >0 counts | Bins with >2000 counts | High rate bins dominated by noise | Noise dominated (total time) | Noise dominated (detector-on time) | Marked lightcurve |
|---|---|---|---|---|---|---|---|
| A | 4523 | 4523 | 43 | 43 | 0.95% | 0.95% |  |
| B | 4524 | 4524 | 0 | 0 | 0.00% | 0.00% |  |
| C | 4523 | 4523 | 0 | 0 | 0.00% | 0.00% |  |
| D | 4524 | 4524 | 55 | 55 | 1.22% | 1.22% |  |
Top three noisy pixels from each quadrant. If the there are fewer than three noisy pixels in the level2.evt file, extra rows are filled as -1
| Pixel properties | Quadrant properties | ||||||
|---|---|---|---|---|---|---|---|
| Quadrant | DetID | PixID | Counts | Sigma | Mean | Median | Sigma |
| A | 1 | 113 | 766832 | 14074.74 | 238 | 234 | 54.5 |
| A | 13 | 254 | 8664 | 154.77 | 238 | 234 | 54.5 |
| A | 6 | 16 | 5866 | 103.4 | 238 | 234 | 54.5 |
| B | 3 | 209 | 14550 | 293.82 | 241 | 235 | 48.7 |
| B | 5 | 255 | 8478 | 169.19 | 241 | 235 | 48.7 |
| B | 0 | 190 | 5977 | 117.86 | 241 | 235 | 48.7 |
| C | 2 | 114 | 8663 | 149.4 | 228 | 226 | 56.5 |
| C | 2 | 16 | 5777 | 98.29 | 228 | 226 | 56.5 |
| C | 15 | 208 | 3660 | 60.81 | 228 | 226 | 56.5 |
| D | 8 | 195 | 943824 | 17081.32 | 230 | 222 | 55.2 |
| D | 1 | 52 | 852538 | 15428.83 | 230 | 222 | 55.2 |
| D | 2 | 250 | 41450 | 746.32 | 230 | 222 | 55.2 |
Histogram calculated using DETX and DETY for each event in the final _common_clean file
| Quadrant A |  |
 |
Quadrant B |
|---|---|---|---|
| Quadrant D |  |
 |
Quadrant C |
| Plot type | Count rate plots | Images |
|---|---|---|
| Comparison with Poisson distribution Blue bars denote a histogram of data divided into 1 sec bins. Red curve is a Poisson curve with rate = median count rate of data. |
 |
 |
| Quadrant-wise count rates Data is divided into 100 sec bins |
 |
|
| Module-wise count rates for Quadrant A Data is divided into 100 sec bins |
 |
 |
| Module-wise count rates for Quadrant B Data is divided into 100 sec bins |
 |
 |
| Module-wise count rates for Quadrant C Data is divided into 100 sec bins |
 |
 |
| Module-wise count rates for Quadrant D Data is divided into 100 sec bins |
 |
 |
| Parameter | Plot |
|---|---|
| CZT HV Monitor |  |
| D_VDD |  |
| Temperature 1 | 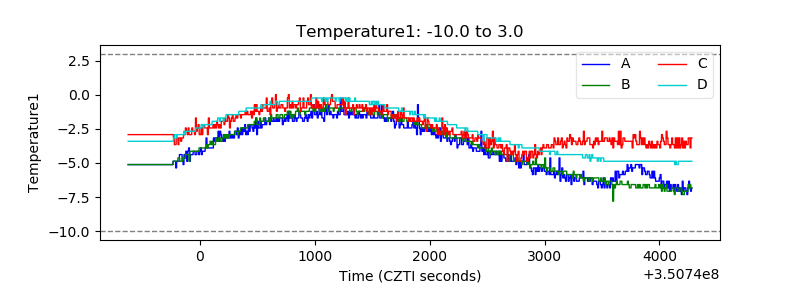 |
| Veto HV Monitor | 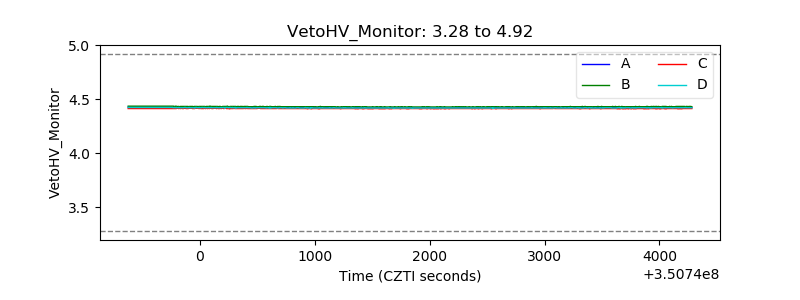 |
| Veto LLD |  |
| Alpha Counter |  |
| _CPM_Rate |  |
| CZT Counter |  |
| +2.5 Volts monitor |  |
| +5 Volts monitor |  |
| _ROLL_ROT |  |
| _Roll_DEC |  |
| _Roll_RA |  |
| Veto Counter | 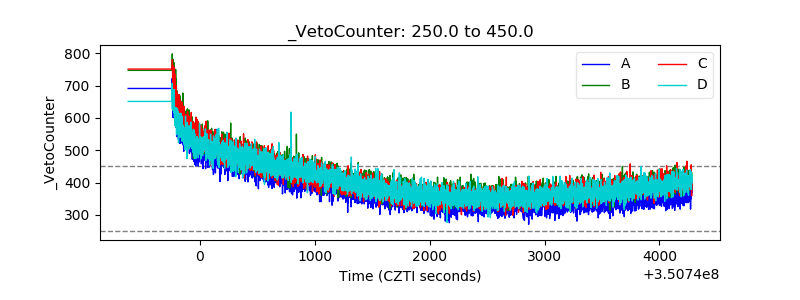 |