| Param | Original file | Final file |
|---|---|---|
| Filename | modeM0/AS1A10_094T20_9000004164cztM0_level2_bc.evt | modeM0/AS1A10_094T20_9000004164cztM0_level2_quad_clean.evt |
| Size (bytes) | 244,143,360 | 106,562,880 |
| Size | 232.8 MB | 101.6 MB |
| Events in quadrant A | 1,210,449 | 724,080 |
| Events in quadrant B | 1,296,349 | 734,030 |
| Events in quadrant C | 1,133,862 | 699,694 |
| Events in quadrant D | 3,343,978 | 657,519 |
| Mode SS | |||
|---|---|---|---|
| Quadrant | BADHDUFLAG | Total packets | Discarded packets |
| A | 0 | 122 | 0 |
| B | 0 | 122 | 0 |
| C | 0 | 122 | 0 |
| D | 0 | 122 | 0 |
| Mode M9 | |||
|---|---|---|---|
| Quadrant | BADHDUFLAG | Total packets | Discarded packets |
| A | 0 | 8 | 0 |
| B | 0 | 8 | 0 |
| C | 0 | 8 | 0 |
| D | 0 | 8 | 0 |
| Mode M0 | |||
|---|---|---|---|
| Quadrant | BADHDUFLAG | Total packets | Discarded packets |
| A | 0 | 12101 | 0 |
| B | 0 | 12376 | 0 |
| C | 0 | 12076 | 0 |
| D | 0 | 19482 | 0 |
| Quadrant | Total seconds | Saturated seconds | Saturation percentage |
|---|---|---|---|
| A | 5897 | 115 | 1.950144% |
| B | 5897 | 124 | 2.102764% |
| C | 5897 | 161 | 2.730202% |
| D | 5897 | 484 | 8.207563% |
Noise dominated data is calculated using 1-second bins in cleaned event files. If a bin has >2000 counts, and if more than 50% of those come from <1% of pixels, then it is considered to be noise-dominated and hence unusable.
| Quadrant | # 1 sec bins | Bins with >0 counts | Bins with >2000 counts | High rate bins dominated by noise | Noise dominated (total time) | Noise dominated (detector-on time) | Marked lightcurve |
|---|---|---|---|---|---|---|---|
| A | 6596 | 5895 | 0 | 0 | 0.00% | 0.00% |  |
| B | 6596 | 5895 | 0 | 0 | 0.00% | 0.00% | 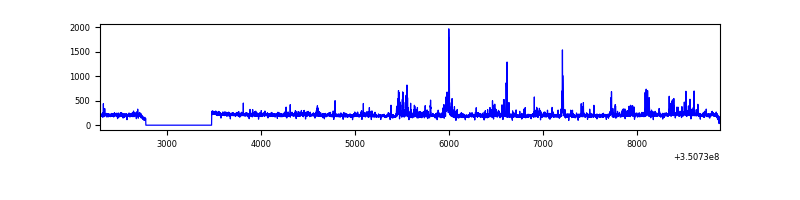 |
| C | 6596 | 5895 | 0 | 0 | 0.00% | 0.00% | 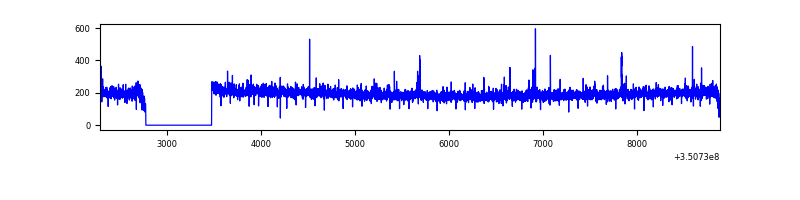 |
| D | 6596 | 5895 | 80 | 80 | 1.21% | 1.36% | 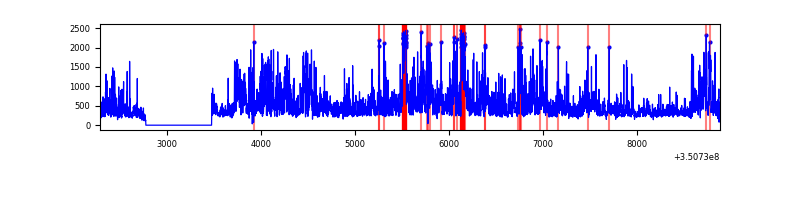 |
Top three noisy pixels from each quadrant. If the there are fewer than three noisy pixels in the level2.evt file, extra rows are filled as -1
| Pixel properties | Quadrant properties | ||||||
|---|---|---|---|---|---|---|---|
| Quadrant | DetID | PixID | Counts | Sigma | Mean | Median | Sigma |
| A | 6 | 16 | 27865 | 403.74 | 300 | 294 | 68.3 |
| A | 1 | 113 | 15879 | 228.22 | 300 | 294 | 68.3 |
| A | 13 | 254 | 10267 | 146.04 | 300 | 294 | 68.3 |
| B | 14 | 167 | 56868 | 935.02 | 302 | 294 | 60.5 |
| B | 5 | 255 | 34873 | 571.5 | 302 | 294 | 60.5 |
| B | 10 | 246 | 16953 | 275.33 | 302 | 294 | 60.5 |
| C | 2 | 114 | 11570 | 160.82 | 289 | 286 | 70.2 |
| C | 2 | 16 | 7665 | 105.17 | 289 | 286 | 70.2 |
| C | 3 | 233 | 2200 | 27.28 | 289 | 286 | 70.2 |
| D | 1 | 52 | 1310183 | 19125.25 | 285 | 274 | 68.5 |
| D | 8 | 195 | 791862 | 11557.53 | 285 | 274 | 68.5 |
| D | 2 | 250 | 85025 | 1237.4 | 285 | 274 | 68.5 |
Histogram calculated using DETX and DETY for each event in the final _common_clean file
| Quadrant A | 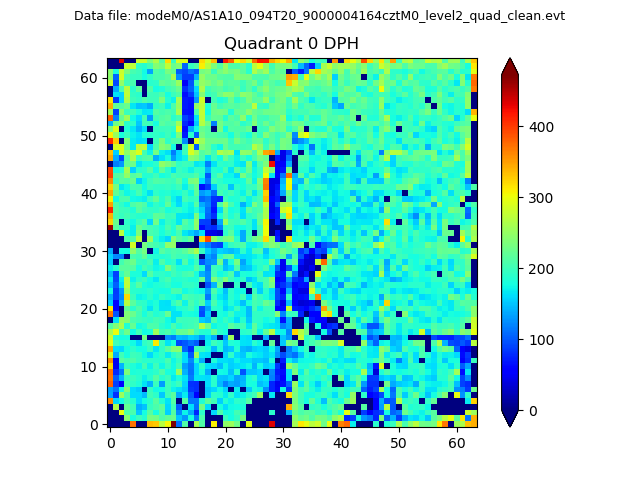 |
 |
Quadrant B |
|---|---|---|---|
| Quadrant D |  |
 |
Quadrant C |
| Plot type | Count rate plots | Images |
|---|---|---|
| Comparison with Poisson distribution Blue bars denote a histogram of data divided into 1 sec bins. Red curve is a Poisson curve with rate = median count rate of data. |
 |
 |
| Quadrant-wise count rates Data is divided into 100 sec bins |
 |
|
| Module-wise count rates for Quadrant A Data is divided into 100 sec bins |
 |
 |
| Module-wise count rates for Quadrant B Data is divided into 100 sec bins |
 |
 |
| Module-wise count rates for Quadrant C Data is divided into 100 sec bins |
 |
 |
| Module-wise count rates for Quadrant D Data is divided into 100 sec bins |
 |
 |
| Parameter | Plot |
|---|---|
| CZT HV Monitor |  |
| D_VDD |  |
| Temperature 1 |  |
| Veto HV Monitor |  |
| Veto LLD |  |
| Alpha Counter |  |
| _CPM_Rate |  |
| CZT Counter | 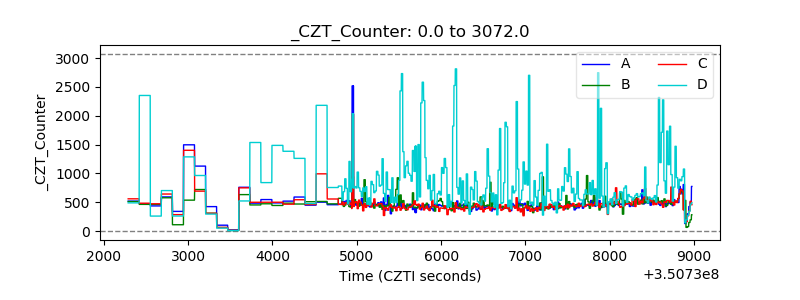 |
| +2.5 Volts monitor |  |
| +5 Volts monitor |  |
| _ROLL_ROT |  |
| _Roll_DEC |  |
| _Roll_RA |  |
| Veto Counter |  |