| Param | Original file | Final file |
|---|---|---|
| Filename | modeM0/AS1C05_019T04_9000004162cztM0_level2_bc.evt | modeM0/AS1C05_019T04_9000004162cztM0_level2_quad_clean.evt |
| Size (bytes) | 3,934,563,840 | 1,665,619,200 |
| Size | 3.7 GB | 1.6 GB |
| Events in quadrant A | 21,421,155 | 10,998,500 |
| Events in quadrant B | 23,436,854 | 11,224,199 |
| Events in quadrant C | 22,173,125 | 10,891,496 |
| Events in quadrant D | 45,185,359 | 10,351,120 |
| Mode SS | |||
|---|---|---|---|
| Quadrant | BADHDUFLAG | Total packets | Discarded packets |
| A | 0 | 2078 | 0 |
| B | 0 | 2078 | 0 |
| C | 0 | 2078 | 0 |
| D | 0 | 2078 | 0 |
| Mode M9 | |||
|---|---|---|---|
| Quadrant | BADHDUFLAG | Total packets | Discarded packets |
| A | 0 | 131 | 0 |
| B | 0 | 131 | 0 |
| C | 0 | 131 | 0 |
| D | 0 | 131 | 0 |
| Mode M0 | |||
|---|---|---|---|
| Quadrant | BADHDUFLAG | Total packets | Discarded packets |
| A | 0 | 211987 | 0 |
| B | 0 | 218657 | 0 |
| C | 0 | 215764 | 0 |
| D | 0 | 293844 | 0 |
| Quadrant | Total seconds | Saturated seconds | Saturation percentage |
|---|---|---|---|
| A | 101981 | 1083 | 1.061963% |
| B | 101981 | 1673 | 1.640502% |
| C | 101981 | 1899 | 1.862112% |
| D | 101981 | 5196 | 5.095067% |
Noise dominated data is calculated using 1-second bins in cleaned event files. If a bin has >2000 counts, and if more than 50% of those come from <1% of pixels, then it is considered to be noise-dominated and hence unusable.
| Quadrant | # 1 sec bins | Bins with >0 counts | Bins with >2000 counts | High rate bins dominated by noise | Noise dominated (total time) | Noise dominated (detector-on time) | Marked lightcurve |
|---|---|---|---|---|---|---|---|
| A | 114901 | 101969 | 0 | 0 | 0.00% | 0.00% |  |
| B | 114900 | 101963 | 40 | 40 | 0.03% | 0.04% | 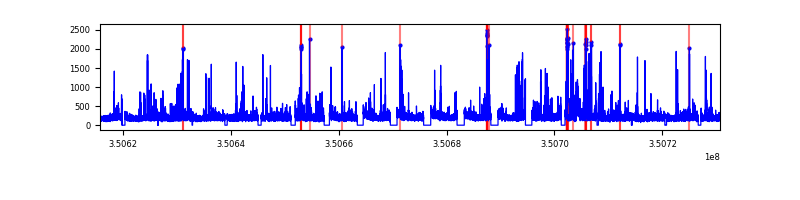 |
| C | 114900 | 101966 | 3 | 3 | 0.00% | 0.00% | 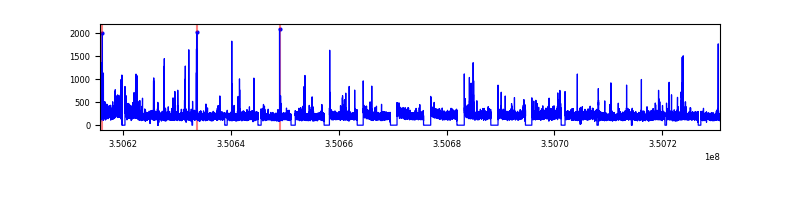 |
| D | 114901 | 101961 | 608 | 608 | 0.53% | 0.60% |  |
Top three noisy pixels from each quadrant. If the there are fewer than three noisy pixels in the level2.evt file, extra rows are filled as -1
| Pixel properties | Quadrant properties | ||||||
|---|---|---|---|---|---|---|---|
| Quadrant | DetID | PixID | Counts | Sigma | Mean | Median | Sigma |
| A | 6 | 16 | 239830 | 199.53 | 5419 | 5329 | 1175.3 |
| A | 13 | 254 | 168569 | 138.89 | 5419 | 5329 | 1175.3 |
| A | 15 | 174 | 118009 | 95.87 | 5419 | 5329 | 1175.3 |
| B | 10 | 246 | 892649 | 857.1 | 5488 | 5373 | 1035.2 |
| B | 10 | 245 | 727504 | 697.57 | 5488 | 5373 | 1035.2 |
| B | 5 | 185 | 172221 | 161.17 | 5488 | 5373 | 1035.2 |
| C | 3 | 233 | 1365246 | 1080.24 | 5296 | 5283 | 1258.9 |
| C | 2 | 16 | 211110 | 163.49 | 5296 | 5283 | 1258.9 |
| C | 2 | 114 | 199582 | 154.33 | 5296 | 5283 | 1258.9 |
| D | 1 | 52 | 13202028 | 10835.63 | 5267 | 5099 | 1217.9 |
| D | 8 | 195 | 9222754 | 7568.36 | 5267 | 5099 | 1217.9 |
| D | 2 | 250 | 999720 | 816.66 | 5267 | 5099 | 1217.9 |
Histogram calculated using DETX and DETY for each event in the final _common_clean file
| Quadrant A |  |
 |
Quadrant B |
|---|---|---|---|
| Quadrant D |  |
 |
Quadrant C |
| Plot type | Count rate plots | Images |
|---|---|---|
| Comparison with Poisson distribution Blue bars denote a histogram of data divided into 1 sec bins. Red curve is a Poisson curve with rate = median count rate of data. |
 |
 |
| Quadrant-wise count rates Data is divided into 100 sec bins |
 |
|
| Module-wise count rates for Quadrant A Data is divided into 100 sec bins |
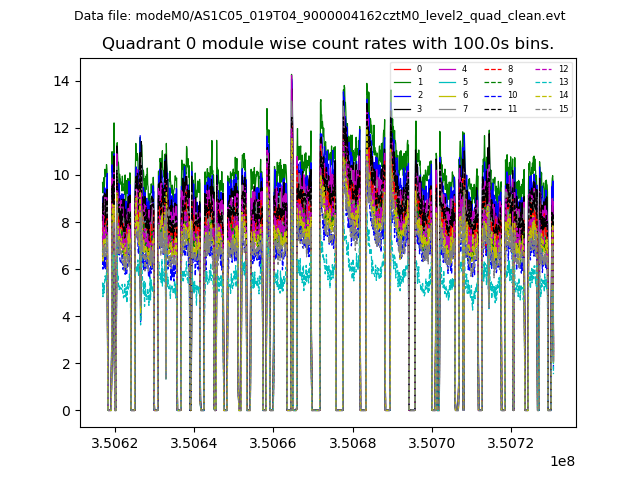 |
 |
| Module-wise count rates for Quadrant B Data is divided into 100 sec bins |
 |
 |
| Module-wise count rates for Quadrant C Data is divided into 100 sec bins |
 |
 |
| Module-wise count rates for Quadrant D Data is divided into 100 sec bins |
 |
 |
| Parameter | Plot |
|---|---|
| CZT HV Monitor |  |
| D_VDD |  |
| Temperature 1 |  |
| Veto HV Monitor |  |
| Veto LLD |  |
| Alpha Counter |  |
| _CPM_Rate |  |
| CZT Counter |  |
| +2.5 Volts monitor |  |
| +5 Volts monitor |  |
| _ROLL_ROT |  |
| _Roll_DEC |  |
| _Roll_RA |  |
| Veto Counter |  |