| Param | Original file | Final file |
|---|---|---|
| Filename | modeM0/AS1A10_123T02_9000004160cztM0_level2_bc.evt | modeM0/AS1A10_123T02_9000004160cztM0_level2_quad_clean.evt |
| Size (bytes) | 4,668,984,000 | 1,558,503,360 |
| Size | 4.3 GB | 1.5 GB |
| Events in quadrant A | 23,291,393 | 10,190,449 |
| Events in quadrant B | 24,110,209 | 10,512,366 |
| Events in quadrant C | 30,371,609 | 9,934,172 |
| Events in quadrant D | 56,252,245 | 9,141,100 |
| Mode M9 | |||
|---|---|---|---|
| Quadrant | BADHDUFLAG | Total packets | Discarded packets |
| A | 0 | 204 | 0 |
| B | 0 | 204 | 0 |
| C | 0 | 204 | 0 |
| D | 0 | 204 | 0 |
| Mode SS | |||
|---|---|---|---|
| Quadrant | BADHDUFLAG | Total packets | Discarded packets |
| A | 0 | 2208 | 0 |
| B | 0 | 2208 | 0 |
| C | 0 | 2208 | 0 |
| D | 0 | 2208 | 0 |
| Mode M0 | |||
|---|---|---|---|
| Quadrant | BADHDUFLAG | Total packets | Discarded packets |
| A | 0 | 226728 | 0 |
| B | 0 | 228597 | 0 |
| C | 0 | 252773 | 0 |
| D | 0 | 348703 | 0 |
| Quadrant | Total seconds | Saturated seconds | Saturation percentage |
|---|---|---|---|
| A | 108387 | 1156 | 1.066549% |
| B | 108387 | 1450 | 1.337799% |
| C | 108387 | 2498 | 2.304704% |
| D | 108387 | 11097 | 10.238313% |
Noise dominated data is calculated using 1-second bins in cleaned event files. If a bin has >2000 counts, and if more than 50% of those come from <1% of pixels, then it is considered to be noise-dominated and hence unusable.
| Quadrant | # 1 sec bins | Bins with >0 counts | Bins with >2000 counts | High rate bins dominated by noise | Noise dominated (total time) | Noise dominated (detector-on time) | Marked lightcurve |
|---|---|---|---|---|---|---|---|
| A | 128829 | 108391 | 0 | 0 | 0.00% | 0.00% |  |
| B | 128829 | 108386 | 2 | 2 | 0.00% | 0.00% |  |
| C | 128828 | 108387 | 4 | 4 | 0.00% | 0.00% |  |
| D | 128829 | 108389 | 1788 | 1788 | 1.39% | 1.65% |  |
Top three noisy pixels from each quadrant. If the there are fewer than three noisy pixels in the level2.evt file, extra rows are filled as -1
| Pixel properties | Quadrant properties | ||||||
|---|---|---|---|---|---|---|---|
| Quadrant | DetID | PixID | Counts | Sigma | Mean | Median | Sigma |
| A | 13 | 254 | 170308 | 128.61 | 6000 | 5903 | 1278.3 |
| A | 1 | 113 | 68848 | 49.24 | 6000 | 5903 | 1278.3 |
| A | 13 | 6 | 39915 | 26.61 | 6000 | 5903 | 1278.3 |
| B | 0 | 229 | 198459 | 170.32 | 6121 | 5985 | 1130.1 |
| B | 10 | 245 | 161487 | 137.6 | 6121 | 5985 | 1130.1 |
| B | 0 | 190 | 152945 | 130.04 | 6121 | 5985 | 1130.1 |
| C | 3 | 233 | 7174927 | 5187.14 | 5847 | 5829 | 1382.1 |
| C | 2 | 16 | 495128 | 354.03 | 5847 | 5829 | 1382.1 |
| C | 2 | 114 | 207221 | 145.72 | 5847 | 5829 | 1382.1 |
| D | 1 | 52 | 16722901 | 13033.64 | 5651 | 5479 | 1282.6 |
| D | 7 | 80 | 12303526 | 9588.1 | 5651 | 5479 | 1282.6 |
| D | 8 | 195 | 5033674 | 3920.2 | 5651 | 5479 | 1282.6 |
Histogram calculated using DETX and DETY for each event in the final _common_clean file
| Quadrant A |  |
 |
Quadrant B |
|---|---|---|---|
| Quadrant D | 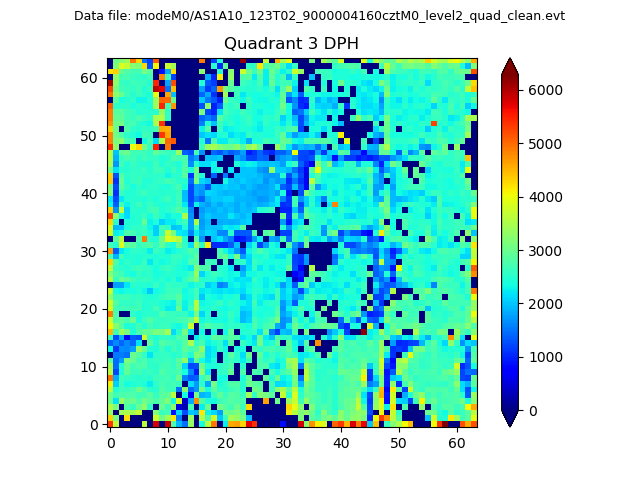 |
 |
Quadrant C |
| Plot type | Count rate plots | Images |
|---|---|---|
| Comparison with Poisson distribution Blue bars denote a histogram of data divided into 1 sec bins. Red curve is a Poisson curve with rate = median count rate of data. |
 |
 |
| Quadrant-wise count rates Data is divided into 100 sec bins |
 |
|
| Module-wise count rates for Quadrant A Data is divided into 100 sec bins |
 |
 |
| Module-wise count rates for Quadrant B Data is divided into 100 sec bins |
 |
 |
| Module-wise count rates for Quadrant C Data is divided into 100 sec bins |
 |
 |
| Module-wise count rates for Quadrant D Data is divided into 100 sec bins |
 |
 |
| Parameter | Plot |
|---|---|
| CZT HV Monitor | 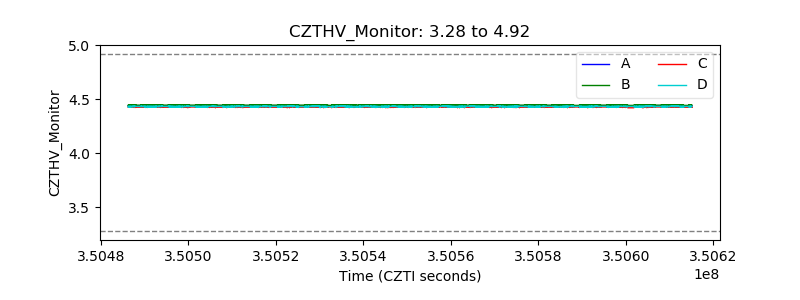 |
| D_VDD |  |
| Temperature 1 | 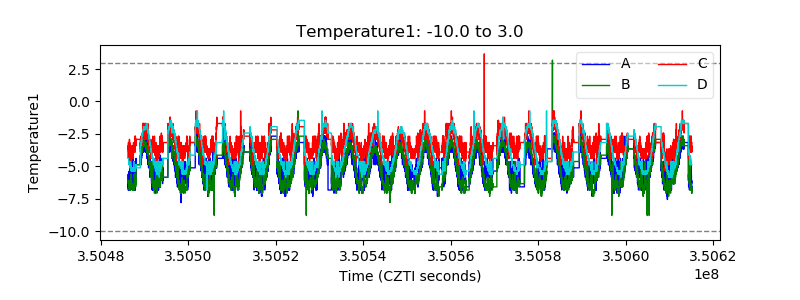 |
| Veto HV Monitor |  |
| Veto LLD | 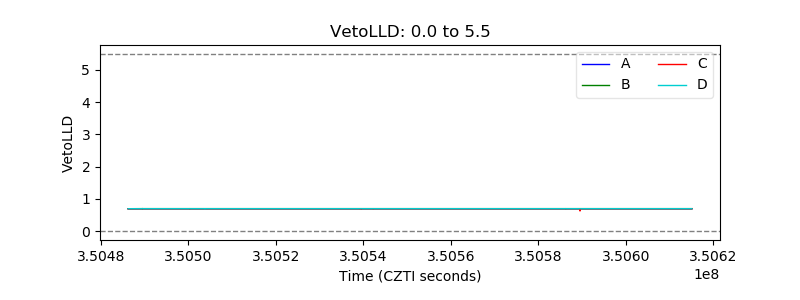 |
| Alpha Counter |  |
| _CPM_Rate |  |
| CZT Counter |  |
| +2.5 Volts monitor |  |
| +5 Volts monitor |  |
| _ROLL_ROT | 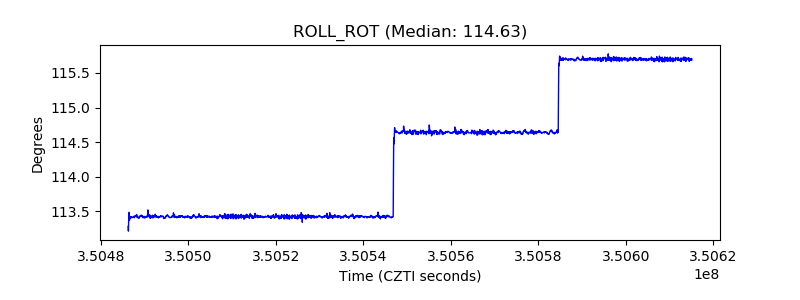 |
| _Roll_DEC |  |
| _Roll_RA |  |
| Veto Counter |  |