| Param | Original file | Final file |
|---|---|---|
| Filename | modeM0/AS1A10_103T04_9000004158cztM0_level2_bc.evt | modeM0/AS1A10_103T04_9000004158cztM0_level2_quad_clean.evt |
| Size (bytes) | 3,081,332,160 | 1,030,642,560 |
| Size | 2.9 GB | 982.9 MB |
| Events in quadrant A | 16,112,769 | 6,771,090 |
| Events in quadrant B | 18,218,503 | 6,818,060 |
| Events in quadrant C | 18,362,601 | 6,470,777 |
| Events in quadrant D | 35,501,625 | 5,997,567 |
| Mode M9 | |||
|---|---|---|---|
| Quadrant | BADHDUFLAG | Total packets | Discarded packets |
| A | 0 | 120 | 0 |
| B | 0 | 120 | 0 |
| C | 0 | 120 | 0 |
| D | 0 | 120 | 0 |
| Mode M0 | |||
|---|---|---|---|
| Quadrant | BADHDUFLAG | Total packets | Discarded packets |
| A | 0 | 156833 | 0 |
| B | 0 | 163942 | 0 |
| C | 0 | 166600 | 0 |
| D | 0 | 223210 | 0 |
| Mode SS | |||
|---|---|---|---|
| Quadrant | BADHDUFLAG | Total packets | Discarded packets |
| A | 0 | 1532 | 0 |
| B | 0 | 1532 | 0 |
| C | 0 | 1532 | 0 |
| D | 0 | 1532 | 0 |
| Quadrant | Total seconds | Saturated seconds | Saturation percentage |
|---|---|---|---|
| A | 75258 | 803 | 1.066996% |
| B | 75258 | 1287 | 1.710117% |
| C | 75258 | 1359 | 1.805788% |
| D | 75258 | 4483 | 5.956842% |
Noise dominated data is calculated using 1-second bins in cleaned event files. If a bin has >2000 counts, and if more than 50% of those come from <1% of pixels, then it is considered to be noise-dominated and hence unusable.
| Quadrant | # 1 sec bins | Bins with >0 counts | Bins with >2000 counts | High rate bins dominated by noise | Noise dominated (total time) | Noise dominated (detector-on time) | Marked lightcurve |
|---|---|---|---|---|---|---|---|
| A | 87212 | 75256 | 0 | 0 | 0.00% | 0.00% | 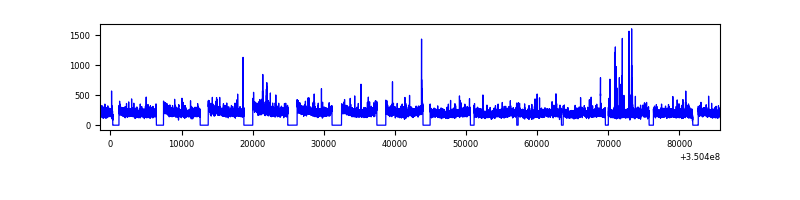 |
| B | 87212 | 75254 | 13 | 13 | 0.01% | 0.02% |  |
| C | 87212 | 75257 | 7 | 7 | 0.01% | 0.01% |  |
| D | 87212 | 75252 | 1144 | 1144 | 1.31% | 1.52% | 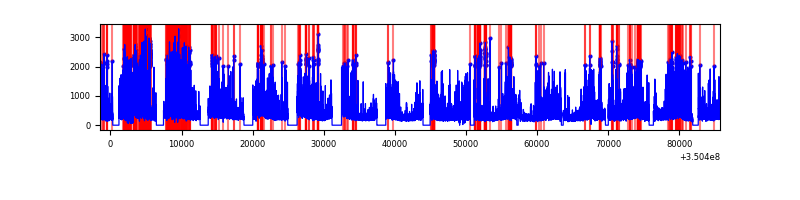 |
Top three noisy pixels from each quadrant. If the there are fewer than three noisy pixels in the level2.evt file, extra rows are filled as -1
| Pixel properties | Quadrant properties | ||||||
|---|---|---|---|---|---|---|---|
| Quadrant | DetID | PixID | Counts | Sigma | Mean | Median | Sigma |
| A | 1 | 113 | 173428 | 191.44 | 4085 | 4004 | 885.0 |
| A | 13 | 254 | 121814 | 133.12 | 4085 | 4004 | 885.0 |
| A | 12 | 210 | 76551 | 81.97 | 4085 | 4004 | 885.0 |
| B | 10 | 245 | 1389698 | 1785.46 | 4107 | 4006 | 776.1 |
| B | 10 | 246 | 532616 | 681.11 | 4107 | 4006 | 776.1 |
| B | 0 | 229 | 227731 | 288.27 | 4107 | 4006 | 776.1 |
| C | 3 | 233 | 2999586 | 3220.95 | 3924 | 3910 | 930.1 |
| C | 2 | 16 | 149140 | 156.15 | 3924 | 3910 | 930.1 |
| C | 2 | 114 | 145300 | 152.02 | 3924 | 3910 | 930.1 |
| D | 1 | 52 | 10684897 | 12130.05 | 3867 | 3744 | 880.6 |
| D | 8 | 195 | 6676635 | 7578.06 | 3867 | 3744 | 880.6 |
| D | 7 | 80 | 1390373 | 1574.72 | 3867 | 3744 | 880.6 |
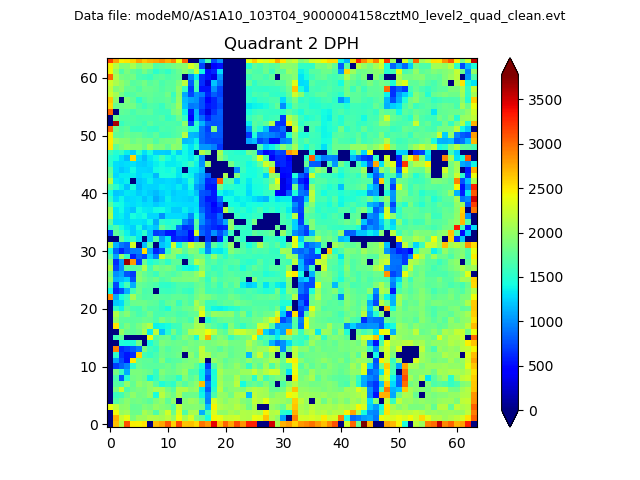
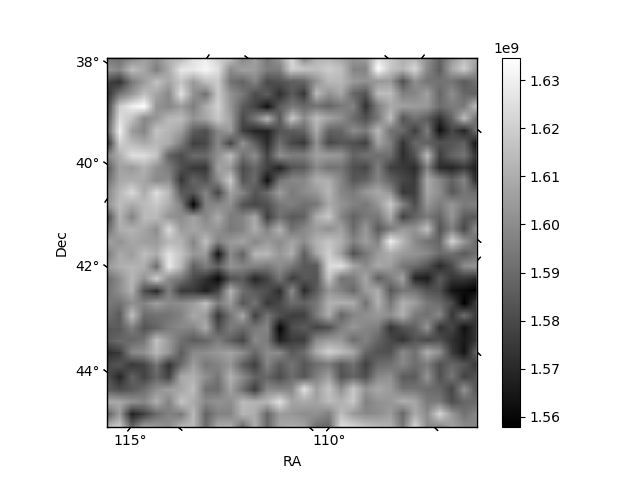
Histogram calculated using DETX and DETY for each event in the final _common_clean file
| Quadrant A |  |
 |
Quadrant B |
|---|---|---|---|
| Quadrant D |  |
 |
Quadrant C |
| Plot type | Count rate plots | Images |
|---|---|---|
| Comparison with Poisson distribution Blue bars denote a histogram of data divided into 1 sec bins. Red curve is a Poisson curve with rate = median count rate of data. |
 |
 |
| Quadrant-wise count rates Data is divided into 100 sec bins |
 |
|
| Module-wise count rates for Quadrant A Data is divided into 100 sec bins |
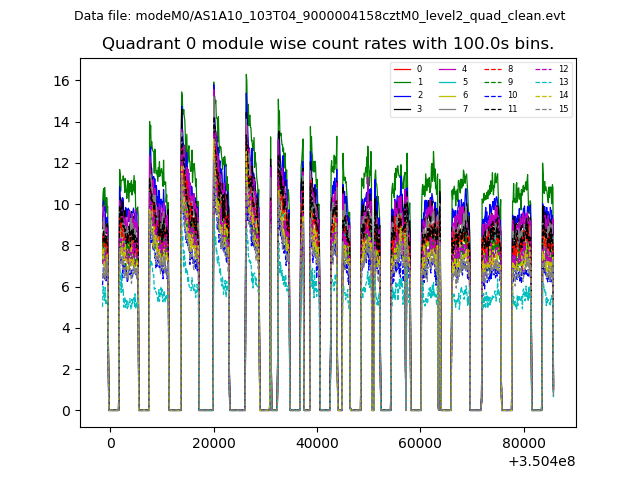 |
 |
| Module-wise count rates for Quadrant B Data is divided into 100 sec bins |
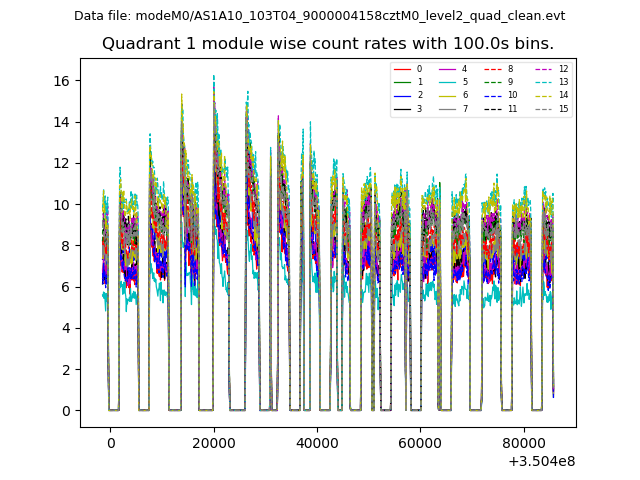 |
 |
| Module-wise count rates for Quadrant C Data is divided into 100 sec bins |
 |
 |
| Module-wise count rates for Quadrant D Data is divided into 100 sec bins |
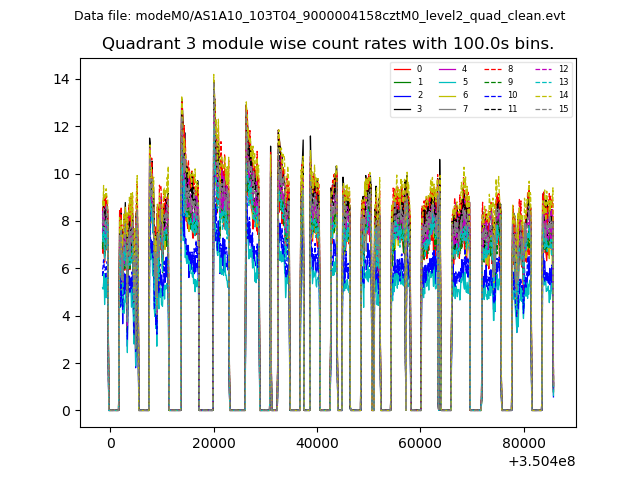 |
 |
| Parameter | Plot |
|---|---|
| CZT HV Monitor | 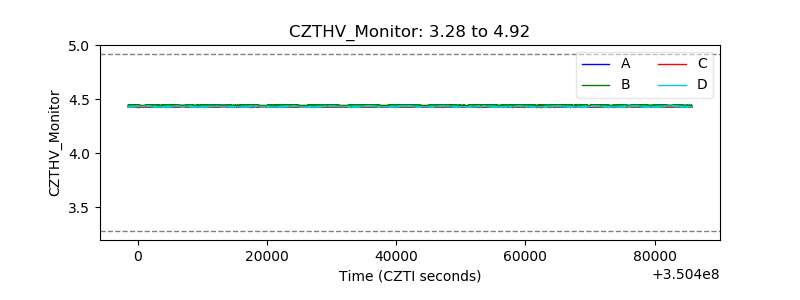 |
| D_VDD |  |
| Temperature 1 |  |
| Veto HV Monitor | 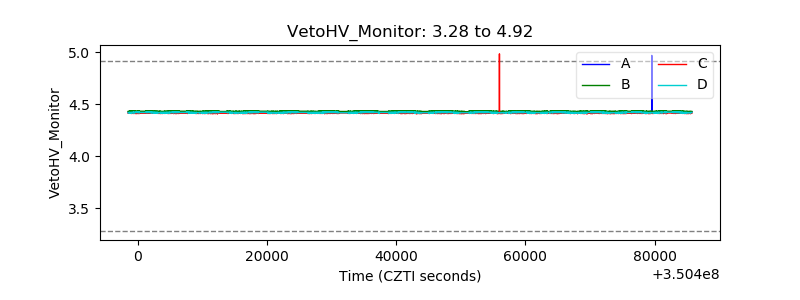 |
| Veto LLD |  |
| Alpha Counter |  |
| _CPM_Rate |  |
| CZT Counter |  |
| +2.5 Volts monitor | 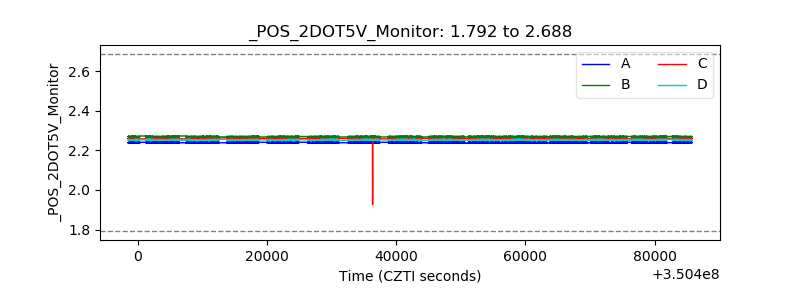 |
| +5 Volts monitor |  |
| _ROLL_ROT |  |
| _Roll_DEC |  |
| _Roll_RA |  |
| Veto Counter |  |