| Param | Original file | Final file |
|---|---|---|
| Filename | modeM0/AS1A10_082T04_9000004150cztM0_level2_bc.evt | modeM0/AS1A10_082T04_9000004150cztM0_level2_quad_clean.evt |
| Size (bytes) | 3,161,646,720 | 798,160,320 |
| Size | 2.9 GB | 761.2 MB |
| Events in quadrant A | 12,753,357 | 5,155,323 |
| Events in quadrant B | 13,362,271 | 5,295,641 |
| Events in quadrant C | 13,173,593 | 5,059,466 |
| Events in quadrant D | 52,324,676 | 4,494,135 |
| Mode SS | |||
|---|---|---|---|
| Quadrant | BADHDUFLAG | Total packets | Discarded packets |
| A | 0 | 1242 | 0 |
| B | 0 | 1242 | 0 |
| C | 0 | 1242 | 0 |
| D | 0 | 1242 | 0 |
| Mode M0 | |||
|---|---|---|---|
| Quadrant | BADHDUFLAG | Total packets | Discarded packets |
| A | 0 | 126225 | 0 |
| B | 0 | 128380 | 0 |
| C | 0 | 129995 | 0 |
| D | 0 | 253803 | 0 |
| Mode M9 | |||
|---|---|---|---|
| Quadrant | BADHDUFLAG | Total packets | Discarded packets |
| A | 0 | 87 | 0 |
| B | 0 | 87 | 0 |
| C | 0 | 87 | 0 |
| D | 0 | 87 | 0 |
| Quadrant | Total seconds | Saturated seconds | Saturation percentage |
|---|---|---|---|
| A | 60750 | 642 | 1.056790% |
| B | 60750 | 936 | 1.540741% |
| C | 60750 | 1765 | 2.905350% |
| D | 60750 | 14784 | 24.335802% |
Noise dominated data is calculated using 1-second bins in cleaned event files. If a bin has >2000 counts, and if more than 50% of those come from <1% of pixels, then it is considered to be noise-dominated and hence unusable.
| Quadrant | # 1 sec bins | Bins with >0 counts | Bins with >2000 counts | High rate bins dominated by noise | Noise dominated (total time) | Noise dominated (detector-on time) | Marked lightcurve |
|---|---|---|---|---|---|---|---|
| A | 69539 | 60751 | 0 | 0 | 0.00% | 0.00% |  |
| B | 69539 | 60749 | 9 | 9 | 0.01% | 0.01% |  |
| C | 69539 | 60748 | 28 | 28 | 0.04% | 0.05% | 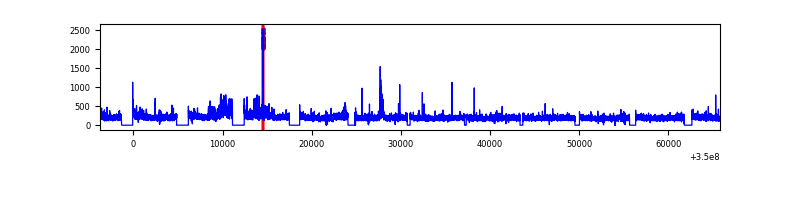 |
| D | 69539 | 60749 | 9288 | 9288 | 13.36% | 15.29% |  |
Top three noisy pixels from each quadrant. If the there are fewer than three noisy pixels in the level2.evt file, extra rows are filled as -1
| Pixel properties | Quadrant properties | ||||||
|---|---|---|---|---|---|---|---|
| Quadrant | DetID | PixID | Counts | Sigma | Mean | Median | Sigma |
| A | 1 | 113 | 170066 | 240.88 | 3210 | 3152 | 692.9 |
| A | 13 | 254 | 97018 | 135.46 | 3210 | 3152 | 692.9 |
| A | 5 | 98 | 84818 | 117.85 | 3210 | 3152 | 692.9 |
| B | 10 | 245 | 587989 | 944.07 | 3262 | 3182 | 619.5 |
| B | 5 | 255 | 56937 | 86.78 | 3262 | 3182 | 619.5 |
| B | 0 | 230 | 51254 | 77.6 | 3262 | 3182 | 619.5 |
| C | 3 | 233 | 850320 | 1159.41 | 3101 | 3087 | 730.7 |
| C | 2 | 16 | 162829 | 218.6 | 3101 | 3087 | 730.7 |
| C | 14 | 254 | 130732 | 174.68 | 3101 | 3087 | 730.7 |
| D | 8 | 195 | 31447040 | 47569.58 | 2861 | 2768 | 661.0 |
| D | 1 | 52 | 9205461 | 13922.04 | 2861 | 2768 | 661.0 |
| D | 12 | 79 | 329175 | 493.8 | 2861 | 2768 | 661.0 |
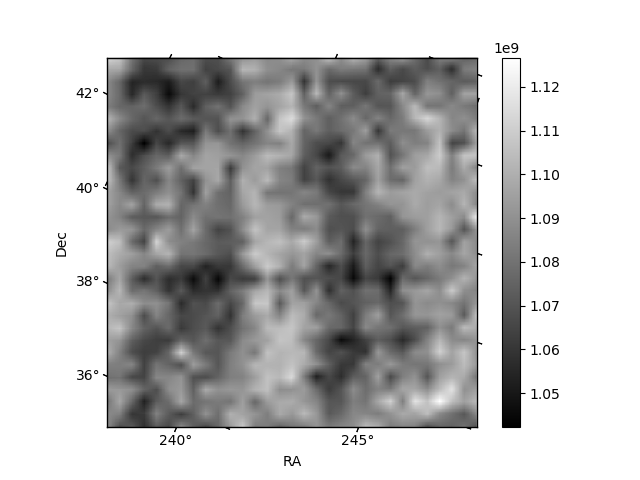
Histogram calculated using DETX and DETY for each event in the final _common_clean file
| Quadrant A |  |
 |
Quadrant B |
|---|---|---|---|
| Quadrant D |  |
 |
Quadrant C |
| Plot type | Count rate plots | Images |
|---|---|---|
| Comparison with Poisson distribution Blue bars denote a histogram of data divided into 1 sec bins. Red curve is a Poisson curve with rate = median count rate of data. |
 |
 |
| Quadrant-wise count rates Data is divided into 100 sec bins |
 |
|
| Module-wise count rates for Quadrant A Data is divided into 100 sec bins |
 |
 |
| Module-wise count rates for Quadrant B Data is divided into 100 sec bins |
 |
 |
| Module-wise count rates for Quadrant C Data is divided into 100 sec bins |
 |
 |
| Module-wise count rates for Quadrant D Data is divided into 100 sec bins |
 |
 |
| Parameter | Plot |
|---|---|
| CZT HV Monitor |  |
| D_VDD |  |
| Temperature 1 |  |
| Veto HV Monitor |  |
| Veto LLD |  |
| Alpha Counter |  |
| _CPM_Rate |  |
| CZT Counter |  |
| +2.5 Volts monitor |  |
| +5 Volts monitor |  |
| _ROLL_ROT |  |
| _Roll_DEC |  |
| _Roll_RA |  |
| Veto Counter |  |