| Param | Original file | Final file |
|---|---|---|
| Filename | modeM0/AS1A10_064T02_9000004146cztM0_level2_bc.evt | modeM0/AS1A10_064T02_9000004146cztM0_level2_quad_clean.evt |
| Size (bytes) | 2,558,888,640 | 466,032,960 |
| Size | 2.4 GB | 444.4 MB |
| Events in quadrant A | 7,637,332 | 3,040,348 |
| Events in quadrant B | 7,524,481 | 3,107,600 |
| Events in quadrant C | 23,313,305 | 2,886,620 |
| Events in quadrant D | 36,542,608 | 2,573,163 |
| Mode M9 | |||
|---|---|---|---|
| Quadrant | BADHDUFLAG | Total packets | Discarded packets |
| A | 0 | 41 | 0 |
| B | 0 | 41 | 0 |
| C | 0 | 41 | 0 |
| D | 0 | 41 | 0 |
| Mode M0 | |||
|---|---|---|---|
| Quadrant | BADHDUFLAG | Total packets | Discarded packets |
| A | 0 | 75826 | 0 |
| B | 0 | 75751 | 0 |
| C | 0 | 127969 | 0 |
| D | 0 | 165154 | 0 |
| Mode SS | |||
|---|---|---|---|
| Quadrant | BADHDUFLAG | Total packets | Discarded packets |
| A | 0 | 744 | 0 |
| B | 0 | 744 | 0 |
| C | 0 | 744 | 0 |
| D | 0 | 744 | 0 |
| Quadrant | Total seconds | Saturated seconds | Saturation percentage |
|---|---|---|---|
| A | 36470 | 511 | 1.401152% |
| B | 36470 | 598 | 1.639704% |
| C | 36469 | 3364 | 9.224273% |
| D | 36469 | 11530 | 31.615893% |
Noise dominated data is calculated using 1-second bins in cleaned event files. If a bin has >2000 counts, and if more than 50% of those come from <1% of pixels, then it is considered to be noise-dominated and hence unusable.
| Quadrant | # 1 sec bins | Bins with >0 counts | Bins with >2000 counts | High rate bins dominated by noise | Noise dominated (total time) | Noise dominated (detector-on time) | Marked lightcurve |
|---|---|---|---|---|---|---|---|
| A | 40550 | 36472 | 0 | 0 | 0.00% | 0.00% | 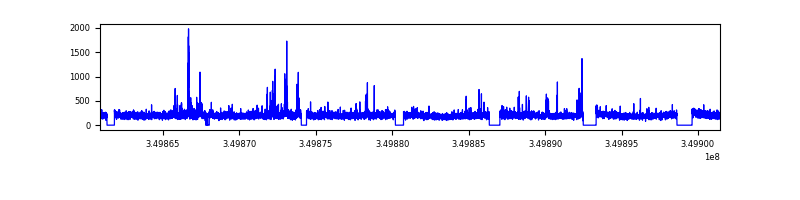 |
| B | 40550 | 36471 | 0 | 0 | 0.00% | 0.00% |  |
| C | 40550 | 36472 | 77 | 77 | 0.19% | 0.21% | 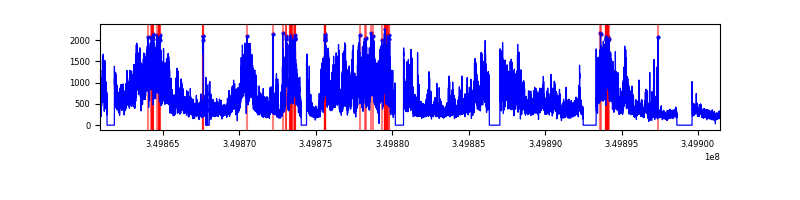 |
| D | 40550 | 36471 | 8575 | 8575 | 21.15% | 23.51% |  |
Top three noisy pixels from each quadrant. If the there are fewer than three noisy pixels in the level2.evt file, extra rows are filled as -1
| Pixel properties | Quadrant properties | ||||||
|---|---|---|---|---|---|---|---|
| Quadrant | DetID | PixID | Counts | Sigma | Mean | Median | Sigma |
| A | 14 | 235 | 238469 | 577.37 | 1873 | 1834 | 409.9 |
| A | 13 | 254 | 66836 | 158.6 | 1873 | 1834 | 409.9 |
| A | 15 | 169 | 39355 | 91.55 | 1873 | 1834 | 409.9 |
| B | 10 | 245 | 63703 | 169.55 | 1897 | 1847 | 364.8 |
| B | 5 | 255 | 46289 | 121.82 | 1897 | 1847 | 364.8 |
| B | 0 | 230 | 39617 | 103.53 | 1897 | 1847 | 364.8 |
| C | 3 | 233 | 16246460 | 38853.77 | 1765 | 1752 | 418.1 |
| C | 15 | 208 | 122816 | 289.56 | 1765 | 1752 | 418.1 |
| C | 2 | 114 | 70418 | 164.23 | 1765 | 1752 | 418.1 |
| D | 8 | 195 | 25573002 | 68367.59 | 1615 | 1559 | 374.0 |
| D | 1 | 52 | 4300356 | 11493.23 | 1615 | 1559 | 374.0 |
| D | 2 | 234 | 146910 | 388.61 | 1615 | 1559 | 374.0 |
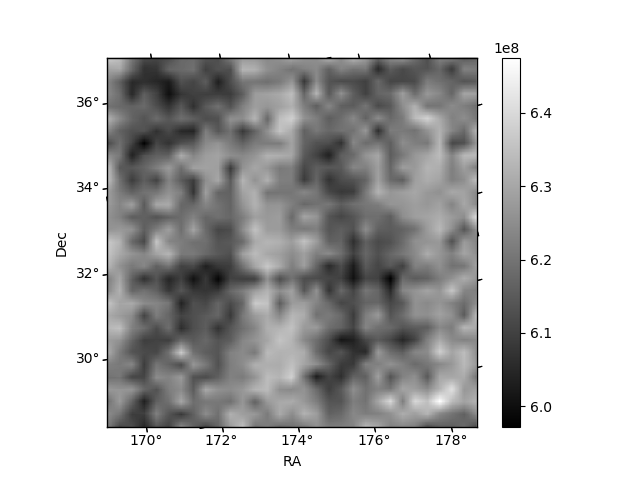
Histogram calculated using DETX and DETY for each event in the final _common_clean file
| Quadrant A |  |
 |
Quadrant B |
|---|---|---|---|
| Quadrant D |  |
 |
Quadrant C |
| Plot type | Count rate plots | Images |
|---|---|---|
| Comparison with Poisson distribution Blue bars denote a histogram of data divided into 1 sec bins. Red curve is a Poisson curve with rate = median count rate of data. |
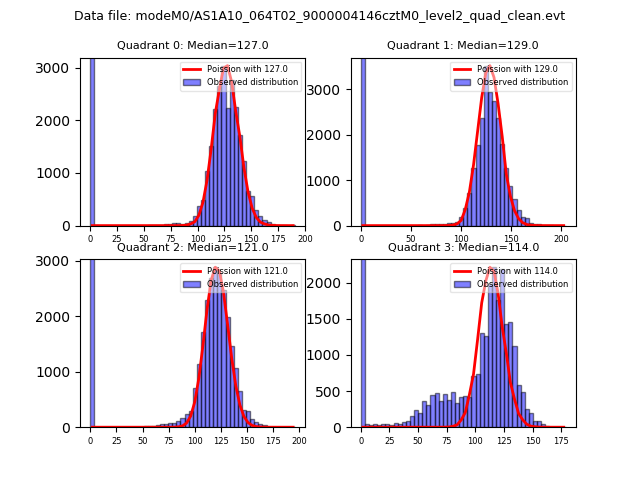 |
 |
| Quadrant-wise count rates Data is divided into 100 sec bins |
 |
|
| Module-wise count rates for Quadrant A Data is divided into 100 sec bins |
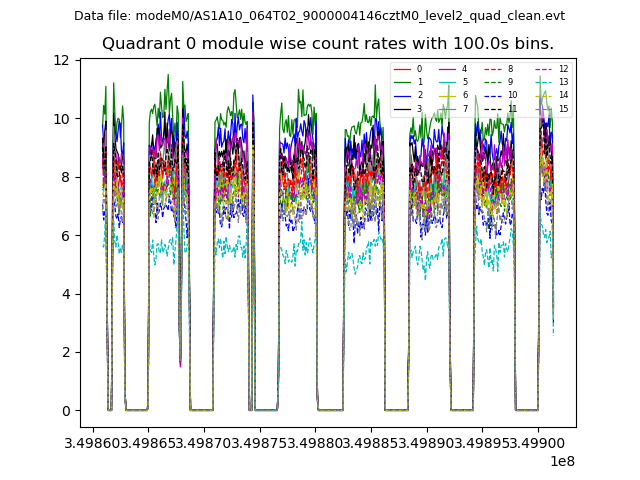 |
 |
| Module-wise count rates for Quadrant B Data is divided into 100 sec bins |
 |
 |
| Module-wise count rates for Quadrant C Data is divided into 100 sec bins |
 |
 |
| Module-wise count rates for Quadrant D Data is divided into 100 sec bins |
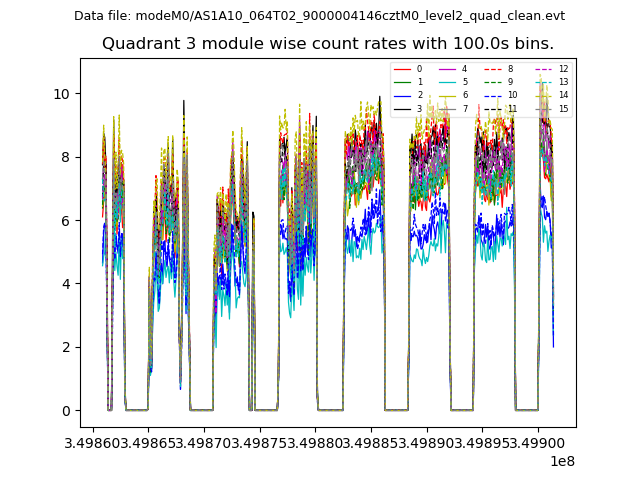 |
 |
| Parameter | Plot |
|---|---|
| CZT HV Monitor |  |
| D_VDD |  |
| Temperature 1 | 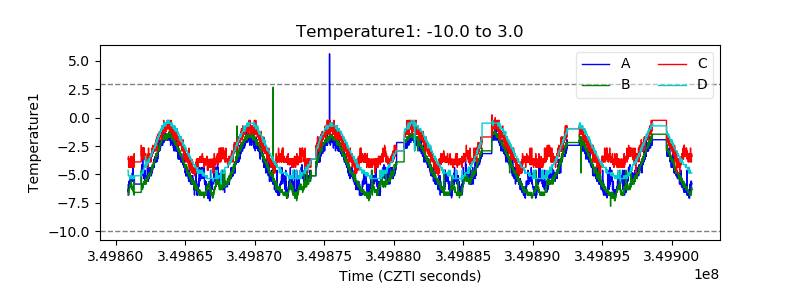 |
| Veto HV Monitor |  |
| Veto LLD |  |
| Alpha Counter |  |
| _CPM_Rate |  |
| CZT Counter |  |
| +2.5 Volts monitor |  |
| +5 Volts monitor |  |
| _ROLL_ROT |  |
| _Roll_DEC |  |
| _Roll_RA | 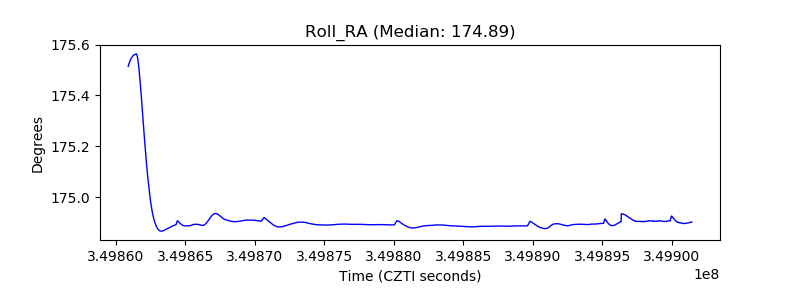 |
| Veto Counter |  |