| Param | Original file | Final file |
|---|---|---|
| Filename | modeM0/AS1A10_048T07_9000004148cztM0_level2_bc.evt | modeM0/AS1A10_048T07_9000004148cztM0_level2_quad_clean.evt |
| Size (bytes) | 4,165,102,080 | 1,079,136,000 |
| Size | 3.9 GB | 1.0 GB |
| Events in quadrant A | 17,125,848 | 6,928,933 |
| Events in quadrant B | 17,751,820 | 7,144,935 |
| Events in quadrant C | 39,341,492 | 6,615,426 |
| Events in quadrant D | 46,467,376 | 6,491,534 |
| Mode M0 | |||
|---|---|---|---|
| Quadrant | BADHDUFLAG | Total packets | Discarded packets |
| A | 0 | 167645 | 0 |
| B | 0 | 170007 | 0 |
| C | 0 | 244800 | 0 |
| D | 0 | 257650 | 0 |
| Mode M9 | |||
|---|---|---|---|
| Quadrant | BADHDUFLAG | Total packets | Discarded packets |
| A | 0 | 132 | 0 |
| B | 0 | 132 | 0 |
| C | 0 | 132 | 0 |
| D | 0 | 132 | 0 |
| Mode SS | |||
|---|---|---|---|
| Quadrant | BADHDUFLAG | Total packets | Discarded packets |
| A | 0 | 1636 | 0 |
| B | 0 | 1636 | 0 |
| C | 0 | 1636 | 0 |
| D | 0 | 1636 | 0 |
| Quadrant | Total seconds | Saturated seconds | Saturation percentage |
|---|---|---|---|
| A | 80294 | 882 | 1.098463% |
| B | 80294 | 1092 | 1.360002% |
| C | 80294 | 5590 | 6.961915% |
| D | 80294 | 5288 | 6.585797% |
Noise dominated data is calculated using 1-second bins in cleaned event files. If a bin has >2000 counts, and if more than 50% of those come from <1% of pixels, then it is considered to be noise-dominated and hence unusable.
| Quadrant | # 1 sec bins | Bins with >0 counts | Bins with >2000 counts | High rate bins dominated by noise | Noise dominated (total time) | Noise dominated (detector-on time) | Marked lightcurve |
|---|---|---|---|---|---|---|---|
| A | 93639 | 80299 | 0 | 0 | 0.00% | 0.00% |  |
| B | 93639 | 80297 | 2 | 2 | 0.00% | 0.00% |  |
| C | 93639 | 80299 | 124 | 124 | 0.13% | 0.15% |  |
| D | 93639 | 80298 | 1998 | 1998 | 2.13% | 2.49% |  |
Top three noisy pixels from each quadrant. If the there are fewer than three noisy pixels in the level2.evt file, extra rows are filled as -1
| Pixel properties | Quadrant properties | ||||||
|---|---|---|---|---|---|---|---|
| Quadrant | DetID | PixID | Counts | Sigma | Mean | Median | Sigma |
| A | 4 | 2 | 272713 | 288.71 | 4327 | 4247 | 929.9 |
| A | 13 | 254 | 133994 | 139.53 | 4327 | 4247 | 929.9 |
| A | 5 | 168 | 48444 | 47.53 | 4327 | 4247 | 929.9 |
| B | 5 | 255 | 373403 | 445.49 | 4402 | 4291 | 828.6 |
| B | 15 | 33 | 181025 | 213.3 | 4402 | 4291 | 828.6 |
| B | 10 | 245 | 117357 | 136.46 | 4402 | 4291 | 828.6 |
| C | 3 | 233 | 22947483 | 23796.6 | 4106 | 4093 | 964.1 |
| C | 15 | 208 | 188576 | 191.34 | 4106 | 4093 | 964.1 |
| C | 14 | 254 | 154389 | 155.88 | 4106 | 4093 | 964.1 |
| D | 8 | 195 | 24363995 | 25747.88 | 4162 | 4021 | 946.1 |
| D | 1 | 52 | 3494255 | 3689.09 | 4162 | 4021 | 946.1 |
| D | 12 | 79 | 2145879 | 2263.89 | 4162 | 4021 | 946.1 |
Histogram calculated using DETX and DETY for each event in the final _common_clean file
| Quadrant A |  |
 |
Quadrant B |
|---|---|---|---|
| Quadrant D | 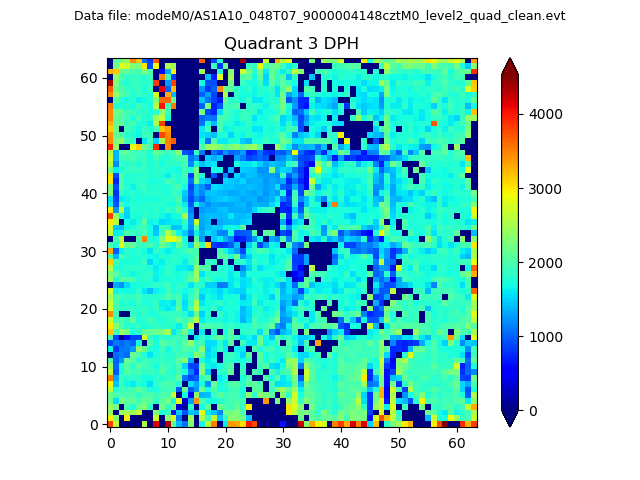 |
 |
Quadrant C |
| Plot type | Count rate plots | Images |
|---|---|---|
| Comparison with Poisson distribution Blue bars denote a histogram of data divided into 1 sec bins. Red curve is a Poisson curve with rate = median count rate of data. |
 |
 |
| Quadrant-wise count rates Data is divided into 100 sec bins |
 |
|
| Module-wise count rates for Quadrant A Data is divided into 100 sec bins |
 |
 |
| Module-wise count rates for Quadrant B Data is divided into 100 sec bins |
 |
 |
| Module-wise count rates for Quadrant C Data is divided into 100 sec bins |
 |
 |
| Module-wise count rates for Quadrant D Data is divided into 100 sec bins |
 |
 |
| Parameter | Plot |
|---|---|
| CZT HV Monitor |  |
| D_VDD |  |
| Temperature 1 |  |
| Veto HV Monitor |  |
| Veto LLD | 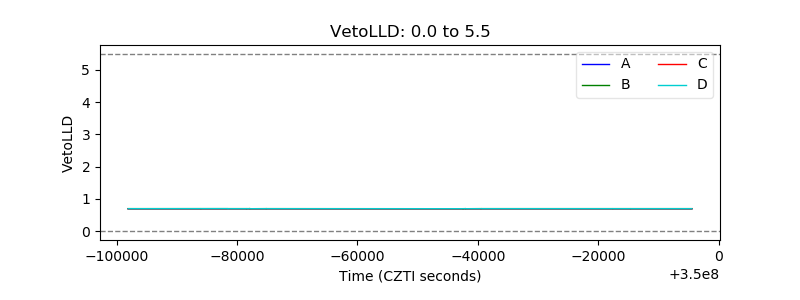 |
| Alpha Counter |  |
| _CPM_Rate | 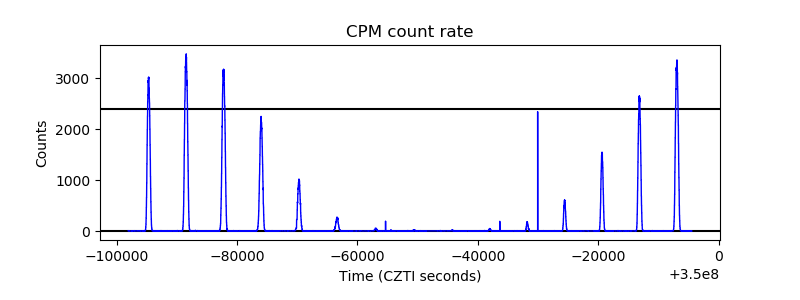 |
| CZT Counter |  |
| +2.5 Volts monitor |  |
| +5 Volts monitor | 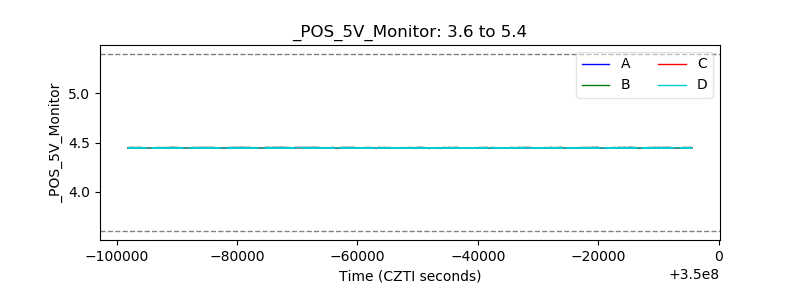 |
| _ROLL_ROT |  |
| _Roll_DEC |  |
| _Roll_RA | 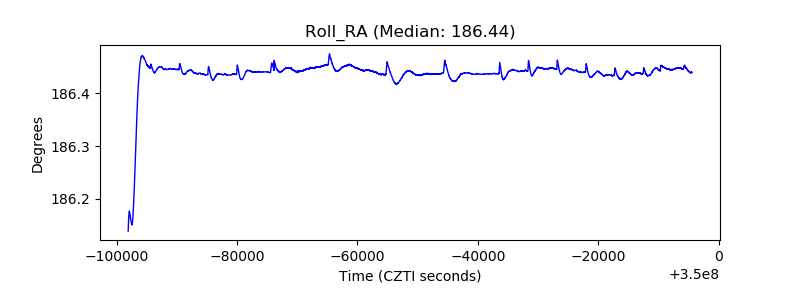 |
| Veto Counter |  |