| Param | Original file | Final file |
|---|---|---|
| Filename | modeM0/AS1A10_115T03_9000004142cztM0_level2_bc.evt | modeM0/AS1A10_115T03_9000004142cztM0_level2_quad_clean.evt |
| Size (bytes) | 1,169,043,840 | 255,631,680 |
| Size | 1.1 GB | 243.8 MB |
| Events in quadrant A | 4,131,387 | 1,623,302 |
| Events in quadrant B | 4,485,989 | 1,646,488 |
| Events in quadrant C | 6,569,098 | 1,569,450 |
| Events in quadrant D | 18,819,577 | 1,490,270 |
| Mode M0 | |||
|---|---|---|---|
| Quadrant | BADHDUFLAG | Total packets | Discarded packets |
| A | 0 | 41909 | 0 |
| B | 0 | 43333 | 0 |
| C | 0 | 50764 | 0 |
| D | 0 | 89147 | 0 |
| Mode SS | |||
|---|---|---|---|
| Quadrant | BADHDUFLAG | Total packets | Discarded packets |
| A | 0 | 418 | 0 |
| B | 0 | 418 | 0 |
| C | 0 | 418 | 0 |
| D | 0 | 418 | 0 |
| Mode M9 | |||
|---|---|---|---|
| Quadrant | BADHDUFLAG | Total packets | Discarded packets |
| A | 0 | 15 | 0 |
| B | 0 | 15 | 0 |
| C | 0 | 15 | 0 |
| D | 0 | 15 | 0 |
| Quadrant | Total seconds | Saturated seconds | Saturation percentage |
|---|---|---|---|
| A | 20498 | 166 | 0.809835% |
| B | 20499 | 289 | 1.409825% |
| C | 20499 | 837 | 4.083126% |
| D | 20499 | 3591 | 17.517928% |
Noise dominated data is calculated using 1-second bins in cleaned event files. If a bin has >2000 counts, and if more than 50% of those come from <1% of pixels, then it is considered to be noise-dominated and hence unusable.
| Quadrant | # 1 sec bins | Bins with >0 counts | Bins with >2000 counts | High rate bins dominated by noise | Noise dominated (total time) | Noise dominated (detector-on time) | Marked lightcurve |
|---|---|---|---|---|---|---|---|
| A | 22043 | 20497 | 1 | 1 | 0.00% | 0.00% | 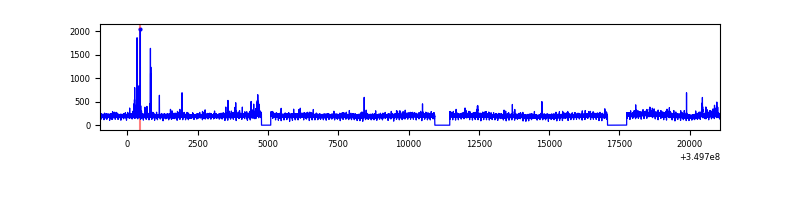 |
| B | 22044 | 20497 | 0 | 0 | 0.00% | 0.00% | 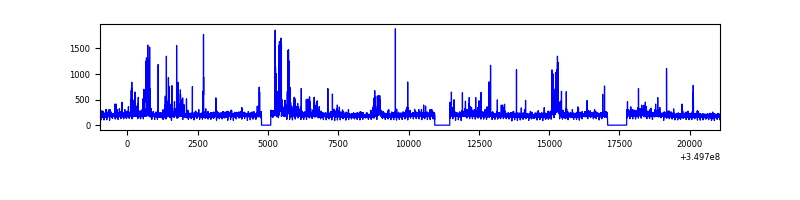 |
| C | 22044 | 20495 | 5 | 5 | 0.02% | 0.02% |  |
| D | 22044 | 20497 | 951 | 951 | 4.31% | 4.64% |  |
Top three noisy pixels from each quadrant. If the there are fewer than three noisy pixels in the level2.evt file, extra rows are filled as -1
| Pixel properties | Quadrant properties | ||||||
|---|---|---|---|---|---|---|---|
| Quadrant | DetID | PixID | Counts | Sigma | Mean | Median | Sigma |
| A | 6 | 16 | 48221 | 208.39 | 1028 | 1007 | 226.6 |
| A | 13 | 254 | 36847 | 158.19 | 1028 | 1007 | 226.6 |
| A | 12 | 96 | 30261 | 129.12 | 1028 | 1007 | 226.6 |
| B | 10 | 245 | 384957 | 1879.66 | 1036 | 1008 | 204.3 |
| B | 0 | 183 | 38993 | 185.96 | 1036 | 1008 | 204.3 |
| B | 5 | 255 | 25717 | 120.97 | 1036 | 1008 | 204.3 |
| C | 3 | 233 | 2164798 | 9292.29 | 977 | 969 | 232.9 |
| C | 15 | 208 | 484708 | 2077.36 | 977 | 969 | 232.9 |
| C | 2 | 16 | 61554 | 260.17 | 977 | 969 | 232.9 |
| D | 8 | 195 | 11673590 | 50465.79 | 961 | 923 | 231.3 |
| D | 1 | 52 | 2944546 | 12726.51 | 961 | 923 | 231.3 |
| D | 7 | 80 | 186277 | 801.36 | 961 | 923 | 231.3 |
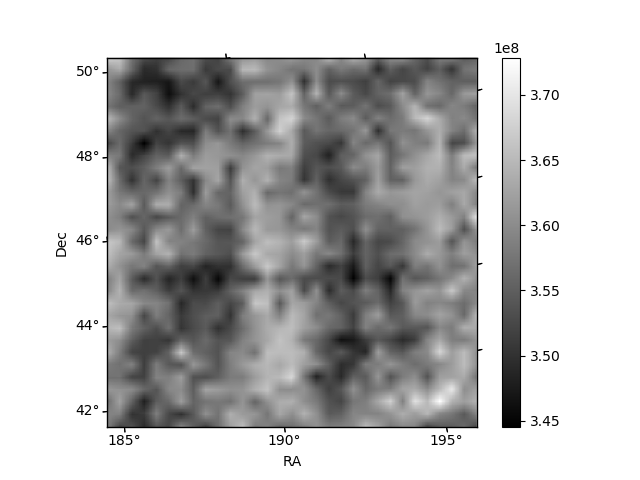
Histogram calculated using DETX and DETY for each event in the final _common_clean file
| Quadrant A |  |
 |
Quadrant B |
|---|---|---|---|
| Quadrant D |  |
 |
Quadrant C |
| Plot type | Count rate plots | Images |
|---|---|---|
| Comparison with Poisson distribution Blue bars denote a histogram of data divided into 1 sec bins. Red curve is a Poisson curve with rate = median count rate of data. |
 |
 |
| Quadrant-wise count rates Data is divided into 100 sec bins |
 |
|
| Module-wise count rates for Quadrant A Data is divided into 100 sec bins |
 |
 |
| Module-wise count rates for Quadrant B Data is divided into 100 sec bins |
 |
 |
| Module-wise count rates for Quadrant C Data is divided into 100 sec bins |
 |
 |
| Module-wise count rates for Quadrant D Data is divided into 100 sec bins |
 |
 |
| Parameter | Plot |
|---|---|
| CZT HV Monitor |  |
| D_VDD | 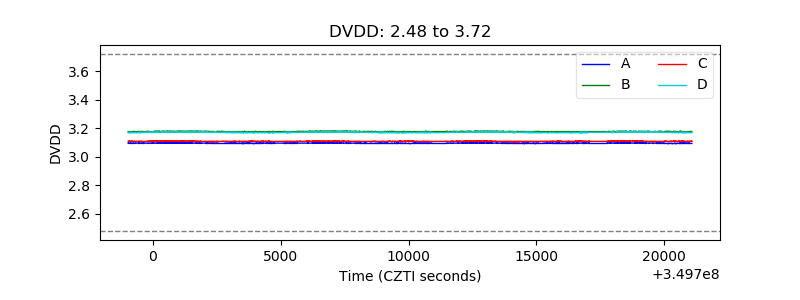 |
| Temperature 1 |  |
| Veto HV Monitor |  |
| Veto LLD |  |
| Alpha Counter |  |
| _CPM_Rate |  |
| CZT Counter |  |
| +2.5 Volts monitor |  |
| +5 Volts monitor |  |
| _ROLL_ROT |  |
| _Roll_DEC |  |
| _Roll_RA |  |
| Veto Counter |  |