| Param | Original file | Final file |
|---|---|---|
| Filename | modeM0/AS1A10_064T01_9000004144cztM0_level2_bc.evt | modeM0/AS1A10_064T01_9000004144cztM0_level2_quad_clean.evt |
| Size (bytes) | 8,915,601,600 | 1,490,290,560 |
| Size | 8.3 GB | 1.4 GB |
| Events in quadrant A | 25,272,881 | 9,986,546 |
| Events in quadrant B | 25,632,550 | 10,191,083 |
| Events in quadrant C | 86,048,354 | 9,045,870 |
| Events in quadrant D | 125,180,664 | 7,933,966 |
| Mode M0 | |||
|---|---|---|---|
| Quadrant | BADHDUFLAG | Total packets | Discarded packets |
| A | 0 | 242377 | 0 |
| B | 0 | 244377 | 0 |
| C | 0 | 444815 | 0 |
| D | 0 | 556194 | 0 |
| Mode SS | |||
|---|---|---|---|
| Quadrant | BADHDUFLAG | Total packets | Discarded packets |
| A | 0 | 2368 | 0 |
| B | 0 | 2368 | 0 |
| C | 0 | 2368 | 0 |
| D | 0 | 2368 | 0 |
| Mode M9 | |||
|---|---|---|---|
| Quadrant | BADHDUFLAG | Total packets | Discarded packets |
| A | 0 | 214 | 0 |
| B | 0 | 214 | 0 |
| C | 0 | 214 | 0 |
| D | 0 | 214 | 0 |
| Quadrant | Total seconds | Saturated seconds | Saturation percentage |
|---|---|---|---|
| A | 116275 | 1048 | 0.901312% |
| B | 116275 | 1505 | 1.294345% |
| C | 116275 | 14718 | 12.657923% |
| D | 116275 | 38771 | 33.344227% |
Noise dominated data is calculated using 1-second bins in cleaned event files. If a bin has >2000 counts, and if more than 50% of those come from <1% of pixels, then it is considered to be noise-dominated and hence unusable.
| Quadrant | # 1 sec bins | Bins with >0 counts | Bins with >2000 counts | High rate bins dominated by noise | Noise dominated (total time) | Noise dominated (detector-on time) | Marked lightcurve |
|---|---|---|---|---|---|---|---|
| A | 137619 | 116263 | 17 | 17 | 0.01% | 0.01% |  |
| B | 137619 | 116260 | 67 | 67 | 0.05% | 0.06% |  |
| C | 137619 | 116260 | 1352 | 1352 | 0.98% | 1.16% |  |
| D | 137619 | 116259 | 26797 | 26797 | 19.47% | 23.05% | 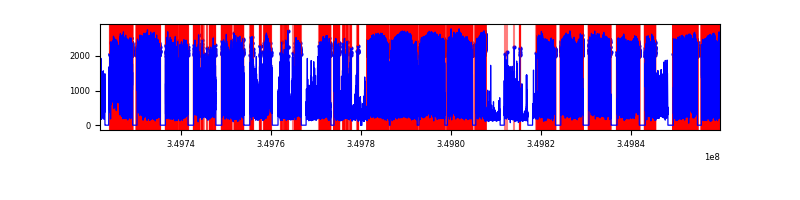 |
Top three noisy pixels from each quadrant. If the there are fewer than three noisy pixels in the level2.evt file, extra rows are filled as -1
| Pixel properties | Quadrant properties | ||||||
|---|---|---|---|---|---|---|---|
| Quadrant | DetID | PixID | Counts | Sigma | Mean | Median | Sigma |
| A | 6 | 16 | 546739 | 398.75 | 6350 | 6253 | 1355.4 |
| A | 13 | 254 | 191817 | 136.9 | 6350 | 6253 | 1355.4 |
| A | 13 | 6 | 111269 | 77.48 | 6350 | 6253 | 1355.4 |
| B | 0 | 229 | 315280 | 253.43 | 6441 | 6284 | 1219.3 |
| B | 10 | 245 | 273594 | 219.24 | 6441 | 6284 | 1219.3 |
| B | 15 | 33 | 150941 | 118.64 | 6441 | 6284 | 1219.3 |
| C | 3 | 233 | 62645635 | 44680.54 | 5905 | 5889 | 1401.9 |
| C | 15 | 208 | 236918 | 164.79 | 5905 | 5889 | 1401.9 |
| C | 2 | 114 | 219974 | 152.71 | 5905 | 5889 | 1401.9 |
| D | 8 | 195 | 86392009 | 68279.75 | 5520 | 5347 | 1265.2 |
| D | 1 | 52 | 15052494 | 11893.22 | 5520 | 5347 | 1265.2 |
| D | 13 | 104 | 1778421 | 1401.43 | 5520 | 5347 | 1265.2 |
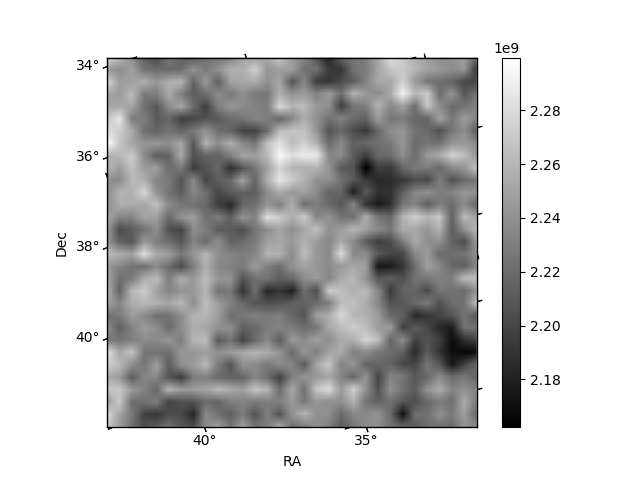
Histogram calculated using DETX and DETY for each event in the final _common_clean file
| Quadrant A | 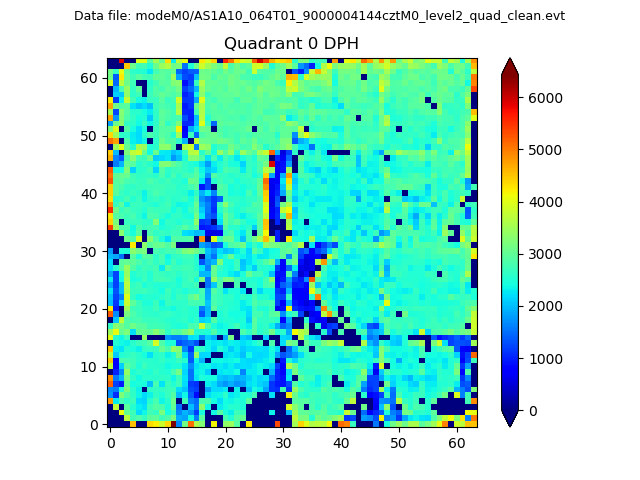 |
 |
Quadrant B |
|---|---|---|---|
| Quadrant D |  |
 |
Quadrant C |
| Plot type | Count rate plots | Images |
|---|---|---|
| Comparison with Poisson distribution Blue bars denote a histogram of data divided into 1 sec bins. Red curve is a Poisson curve with rate = median count rate of data. |
 |
 |
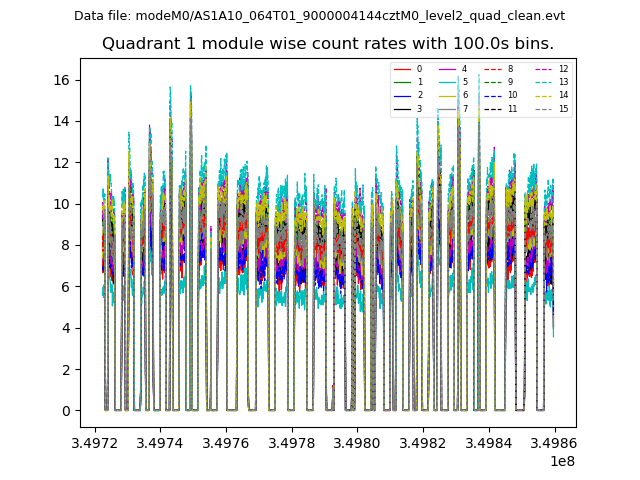
| Quadrant-wise count rates Data is divided into 100 sec bins |
 |
|
| Module-wise count rates for Quadrant A Data is divided into 100 sec bins |
 |
 |
| Module-wise count rates for Quadrant B Data is divided into 100 sec bins |
 |
 |
| Module-wise count rates for Quadrant C Data is divided into 100 sec bins |
 |
 |
| Module-wise count rates for Quadrant D Data is divided into 100 sec bins |
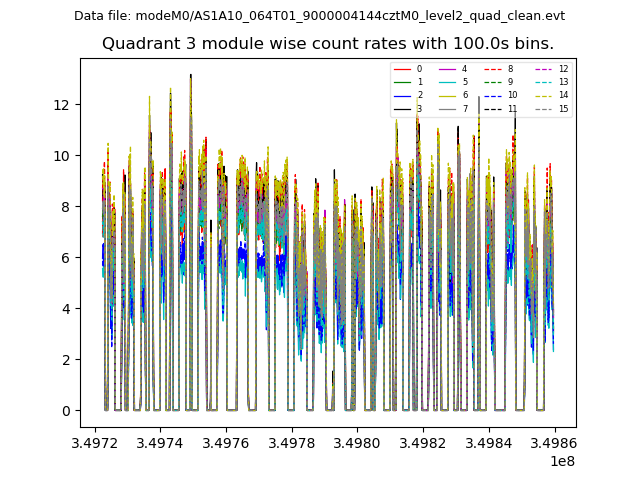 |
 |
| Parameter | Plot |
|---|---|
| CZT HV Monitor |  |
| D_VDD |  |
| Temperature 1 |  |
| Veto HV Monitor | 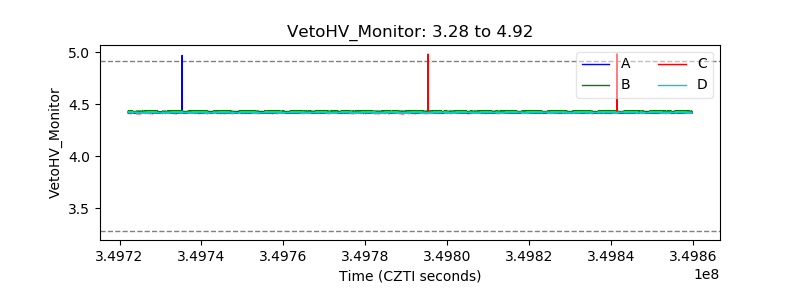 |
| Veto LLD |  |
| Alpha Counter |  |
| _CPM_Rate |  |
| CZT Counter | 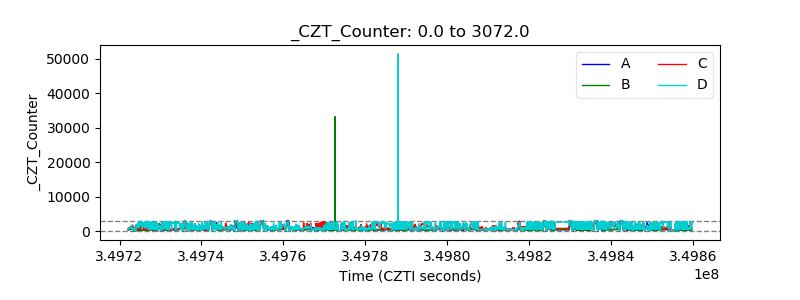 |
| +2.5 Volts monitor |  |
| +5 Volts monitor |  |
| _ROLL_ROT | 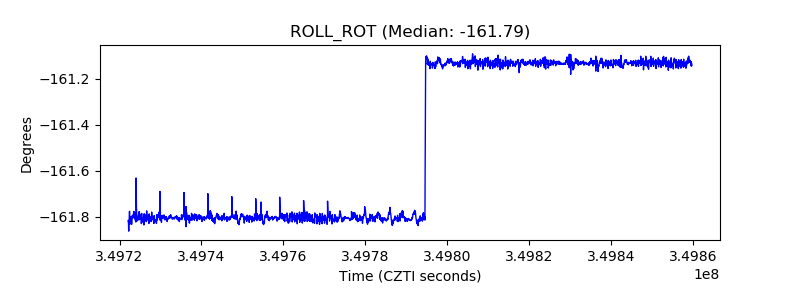 |
| _Roll_DEC |  |
| _Roll_RA |  |
| Veto Counter |  |