| Param | Original file | Final file |
|---|---|---|
| Filename | modeM0/AS1A10_123T07_9000004140cztM0_level2_bc.evt | modeM0/AS1A10_123T07_9000004140cztM0_level2_quad_clean.evt |
| Size (bytes) | 2,908,437,120 | 726,814,080 |
| Size | 2.7 GB | 693.1 MB |
| Events in quadrant A | 11,409,065 | 4,729,752 |
| Events in quadrant B | 12,896,869 | 4,861,283 |
| Events in quadrant C | 12,085,926 | 4,641,288 |
| Events in quadrant D | 48,065,208 | 4,122,492 |
| Mode M9 | |||
|---|---|---|---|
| Quadrant | BADHDUFLAG | Total packets | Discarded packets |
| A | 0 | 101 | 0 |
| B | 0 | 101 | 0 |
| C | 0 | 101 | 0 |
| D | 0 | 101 | 0 |
| Mode M0 | |||
|---|---|---|---|
| Quadrant | BADHDUFLAG | Total packets | Discarded packets |
| A | 0 | 110156 | 0 |
| B | 0 | 115716 | 0 |
| C | 0 | 114534 | 0 |
| D | 0 | 234063 | 0 |
| Mode SS | |||
|---|---|---|---|
| Quadrant | BADHDUFLAG | Total packets | Discarded packets |
| A | 0 | 1092 | 0 |
| B | 0 | 1092 | 0 |
| C | 0 | 1092 | 0 |
| D | 0 | 1092 | 0 |
| Quadrant | Total seconds | Saturated seconds | Saturation percentage |
|---|---|---|---|
| A | 53301 | 366 | 0.686666% |
| B | 53301 | 719 | 1.348943% |
| C | 53301 | 1144 | 2.146301% |
| D | 53301 | 9459 | 17.746384% |
Noise dominated data is calculated using 1-second bins in cleaned event files. If a bin has >2000 counts, and if more than 50% of those come from <1% of pixels, then it is considered to be noise-dominated and hence unusable.
| Quadrant | # 1 sec bins | Bins with >0 counts | Bins with >2000 counts | High rate bins dominated by noise | Noise dominated (total time) | Noise dominated (detector-on time) | Marked lightcurve |
|---|---|---|---|---|---|---|---|
| A | 63666 | 53296 | 0 | 0 | 0.00% | 0.00% |  |
| B | 63666 | 53295 | 15 | 15 | 0.02% | 0.03% |  |
| C | 63666 | 53293 | 13 | 13 | 0.02% | 0.02% | 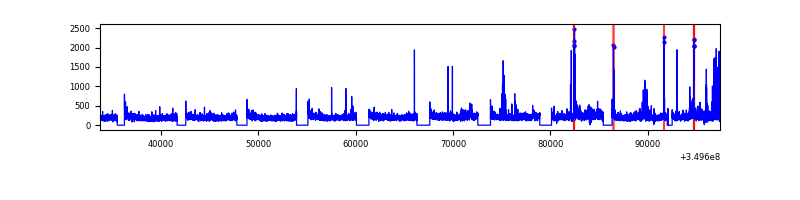 |
| D | 63666 | 53290 | 2016 | 2016 | 3.17% | 3.78% |  |
Top three noisy pixels from each quadrant. If the there are fewer than three noisy pixels in the level2.evt file, extra rows are filled as -1
| Pixel properties | Quadrant properties | ||||||
|---|---|---|---|---|---|---|---|
| Quadrant | DetID | PixID | Counts | Sigma | Mean | Median | Sigma |
| A | 13 | 254 | 91694 | 142.77 | 2903 | 2859 | 622.2 |
| A | 13 | 6 | 83194 | 129.11 | 2903 | 2859 | 622.2 |
| A | 12 | 96 | 34415 | 50.72 | 2903 | 2859 | 622.2 |
| B | 10 | 246 | 837257 | 1506.02 | 2946 | 2881 | 554.0 |
| B | 10 | 245 | 541693 | 972.54 | 2946 | 2881 | 554.0 |
| B | 15 | 32 | 64757 | 111.68 | 2946 | 2881 | 554.0 |
| C | 3 | 233 | 758962 | 1138.83 | 2798 | 2784 | 664.0 |
| C | 15 | 208 | 271390 | 404.53 | 2798 | 2784 | 664.0 |
| C | 2 | 16 | 131919 | 194.48 | 2798 | 2784 | 664.0 |
| D | 8 | 195 | 27753057 | 45249.84 | 2650 | 2566 | 613.3 |
| D | 7 | 80 | 6674973 | 10880.0 | 2650 | 2566 | 613.3 |
| D | 1 | 52 | 2521020 | 4106.58 | 2650 | 2566 | 613.3 |
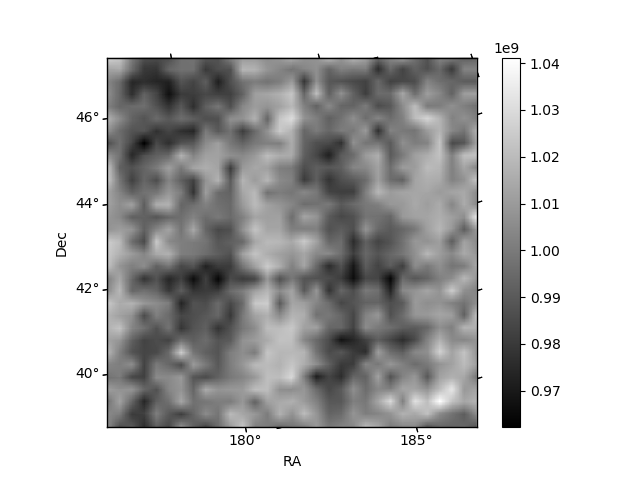
Histogram calculated using DETX and DETY for each event in the final _common_clean file
| Quadrant A |  |
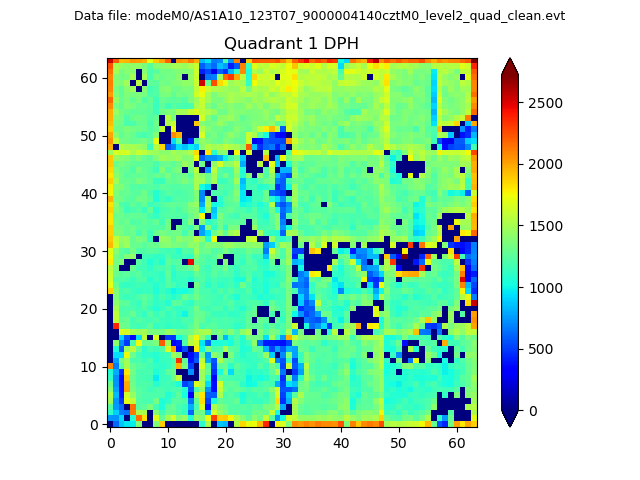 |
Quadrant B |
|---|---|---|---|
| Quadrant D |  |
 |
Quadrant C |
| Plot type | Count rate plots | Images |
|---|---|---|
| Comparison with Poisson distribution Blue bars denote a histogram of data divided into 1 sec bins. Red curve is a Poisson curve with rate = median count rate of data. |
 |
 |
| Quadrant-wise count rates Data is divided into 100 sec bins |
 |
|
| Module-wise count rates for Quadrant A Data is divided into 100 sec bins |
 |
 |
| Module-wise count rates for Quadrant B Data is divided into 100 sec bins |
 |
 |
| Module-wise count rates for Quadrant C Data is divided into 100 sec bins |
 |
 |
| Module-wise count rates for Quadrant D Data is divided into 100 sec bins |
 |
 |
| Parameter | Plot |
|---|---|
| CZT HV Monitor |  |
| D_VDD | 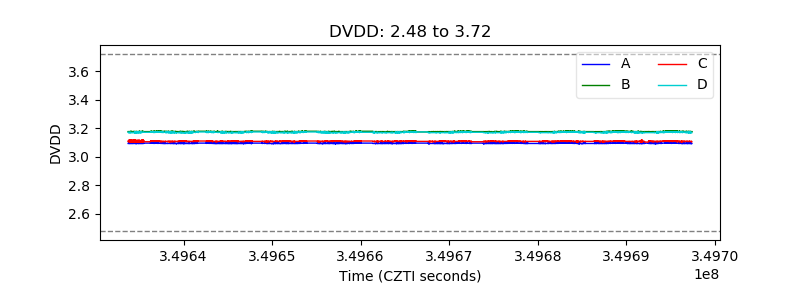 |
| Temperature 1 |  |
| Veto HV Monitor |  |
| Veto LLD | 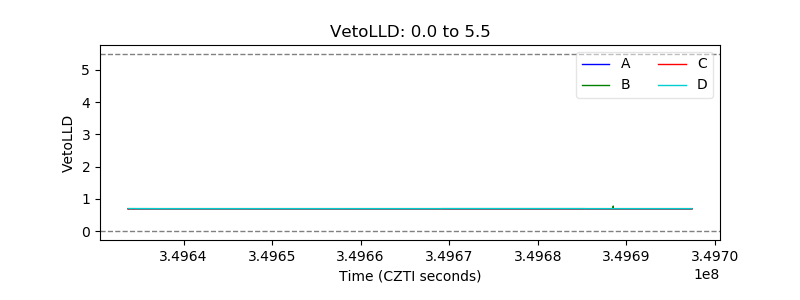 |
| Alpha Counter | 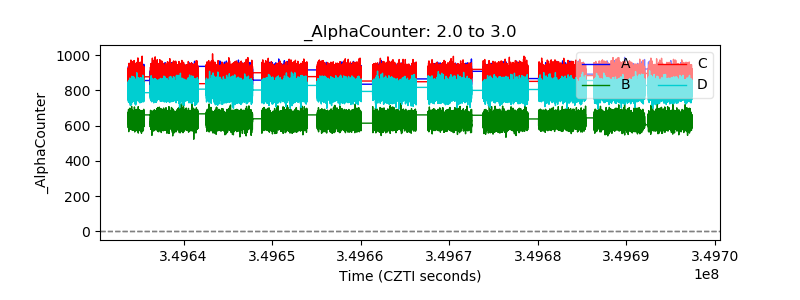 |
| _CPM_Rate | 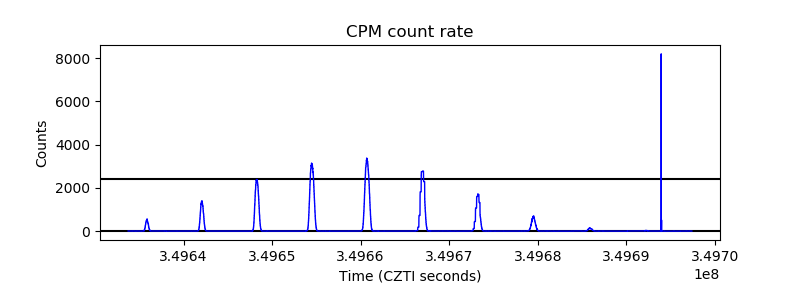 |
| CZT Counter |  |
| +2.5 Volts monitor |  |
| +5 Volts monitor |  |
| _ROLL_ROT |  |
| _Roll_DEC |  |
| _Roll_RA |  |
| Veto Counter |  |