| Param | Original file | Final file |
|---|---|---|
| Filename | modeM0/AS1A10_123T06_9000004138cztM0_level2_bc.evt | modeM0/AS1A10_123T06_9000004138cztM0_level2_quad_clean.evt |
| Size (bytes) | 3,244,461,120 | 689,316,480 |
| Size | 3.0 GB | 657.4 MB |
| Events in quadrant A | 12,886,756 | 4,483,661 |
| Events in quadrant B | 12,322,343 | 4,557,082 |
| Events in quadrant C | 14,305,889 | 4,373,739 |
| Events in quadrant D | 55,195,643 | 3,878,172 |
| Mode M0 | |||
|---|---|---|---|
| Quadrant | BADHDUFLAG | Total packets | Discarded packets |
| A | 0 | 113713 | 0 |
| B | 0 | 115154 | 0 |
| C | 0 | 119876 | 0 |
| D | 0 | 245755 | 0 |
| Mode SS | |||
|---|---|---|---|
| Quadrant | BADHDUFLAG | Total packets | Discarded packets |
| A | 0 | 1060 | 0 |
| B | 0 | 1060 | 0 |
| C | 0 | 1062 | 0 |
| D | 0 | 1058 | 0 |
| Mode M9 | |||
|---|---|---|---|
| Quadrant | BADHDUFLAG | Total packets | Discarded packets |
| A | 0 | 80 | 0 |
| B | 0 | 80 | 0 |
| C | 0 | 81 | 0 |
| D | 0 | 81 | 0 |
| Quadrant | Total seconds | Saturated seconds | Saturation percentage |
|---|---|---|---|
| A | 52211 | 950 | 1.819540% |
| B | 52228 | 1679 | 3.214751% |
| C | 52208 | 1508 | 2.888446% |
| D | 52195 | 14067 | 26.950857% |
Noise dominated data is calculated using 1-second bins in cleaned event files. If a bin has >2000 counts, and if more than 50% of those come from <1% of pixels, then it is considered to be noise-dominated and hence unusable.
| Quadrant | # 1 sec bins | Bins with >0 counts | Bins with >2000 counts | High rate bins dominated by noise | Noise dominated (total time) | Noise dominated (detector-on time) | Marked lightcurve |
|---|---|---|---|---|---|---|---|
| A | 63966 | 52258 | 33 | 33 | 0.05% | 0.06% | 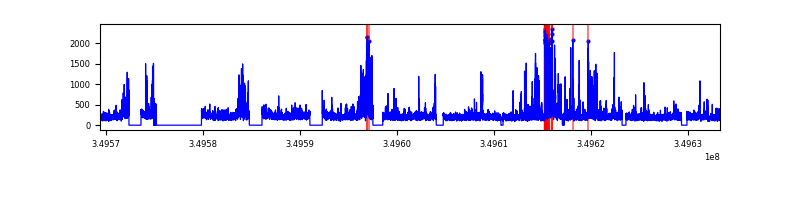 |
| B | 63966 | 52272 | 28 | 28 | 0.04% | 0.05% |  |
| C | 63966 | 52255 | 9 | 9 | 0.01% | 0.02% |  |
| D | 63966 | 52230 | 8503 | 8503 | 13.29% | 16.28% |  |
Top three noisy pixels from each quadrant. If the there are fewer than three noisy pixels in the level2.evt file, extra rows are filled as -1
| Pixel properties | Quadrant properties | ||||||
|---|---|---|---|---|---|---|---|
| Quadrant | DetID | PixID | Counts | Sigma | Mean | Median | Sigma |
| A | 14 | 235 | 1636876 | 2683.34 | 2813 | 2763 | 609.0 |
| A | 1 | 113 | 266393 | 432.9 | 2813 | 2763 | 609.0 |
| A | 13 | 254 | 90622 | 144.27 | 2813 | 2763 | 609.0 |
| B | 10 | 245 | 764921 | 1440.46 | 2811 | 2749 | 529.1 |
| B | 5 | 255 | 344687 | 646.24 | 2811 | 2749 | 529.1 |
| B | 15 | 32 | 124952 | 230.96 | 2811 | 2749 | 529.1 |
| C | 3 | 233 | 3548939 | 5573.37 | 2693 | 2677 | 636.3 |
| C | 4 | 254 | 310802 | 484.26 | 2693 | 2677 | 636.3 |
| C | 14 | 254 | 42067 | 61.91 | 2693 | 2677 | 636.3 |
| D | 8 | 195 | 40211758 | 67201.96 | 2547 | 2458 | 598.3 |
| D | 1 | 52 | 3119826 | 5210.07 | 2547 | 2458 | 598.3 |
| D | 7 | 80 | 1500278 | 2503.31 | 2547 | 2458 | 598.3 |
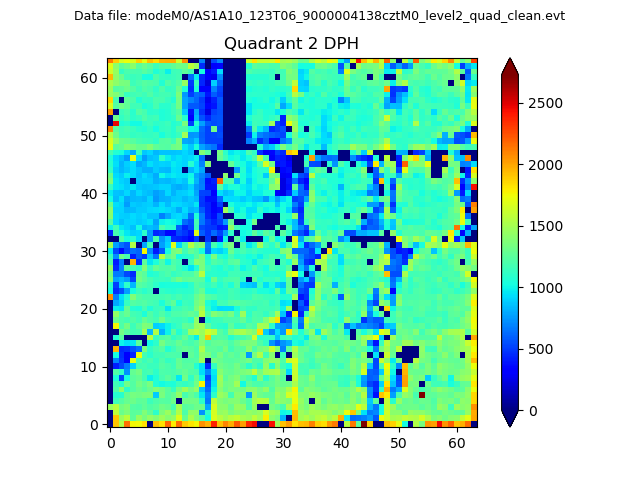
Histogram calculated using DETX and DETY for each event in the final _common_clean file
| Quadrant A |  |
 |
Quadrant B |
|---|---|---|---|
| Quadrant D | 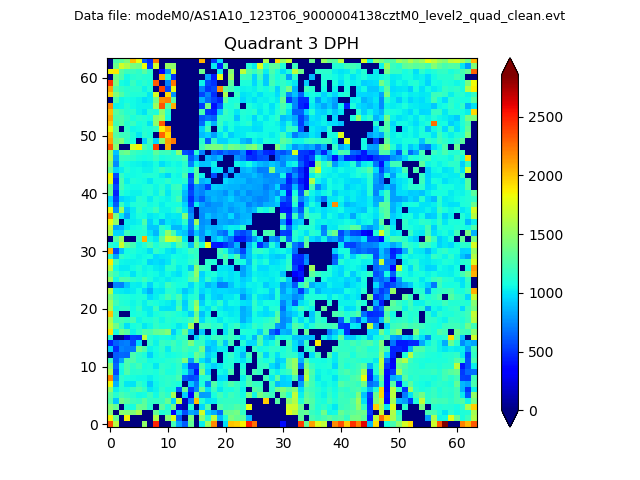 |
 |
Quadrant C |
| Plot type | Count rate plots | Images |
|---|---|---|
| Comparison with Poisson distribution Blue bars denote a histogram of data divided into 1 sec bins. Red curve is a Poisson curve with rate = median count rate of data. |
 |
 |
| Quadrant-wise count rates Data is divided into 100 sec bins |
 |
|
| Module-wise count rates for Quadrant A Data is divided into 100 sec bins |
 |
 |
| Module-wise count rates for Quadrant B Data is divided into 100 sec bins |
 |
 |
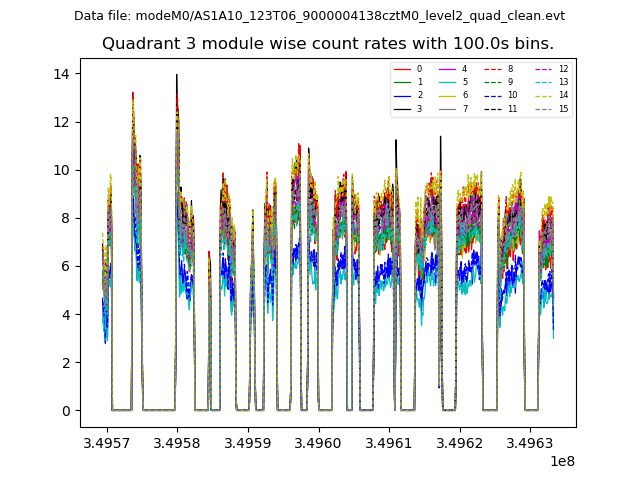
| Module-wise count rates for Quadrant C Data is divided into 100 sec bins |
 |
 |
| Module-wise count rates for Quadrant D Data is divided into 100 sec bins |
 |
 |
| Parameter | Plot |
|---|---|
| CZT HV Monitor |  |
| D_VDD |  |
| Temperature 1 |  |
| Veto HV Monitor |  |
| Veto LLD |  |
| Alpha Counter | 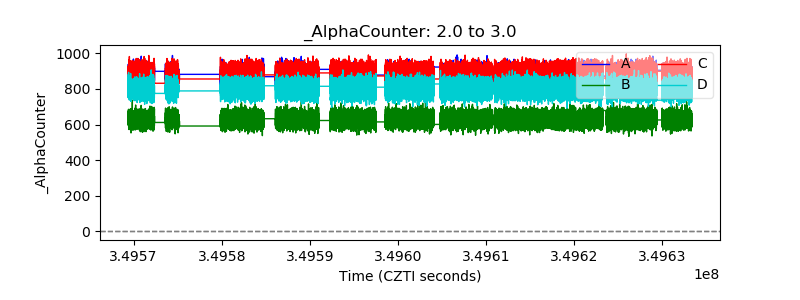 |
| _CPM_Rate |  |
| CZT Counter | 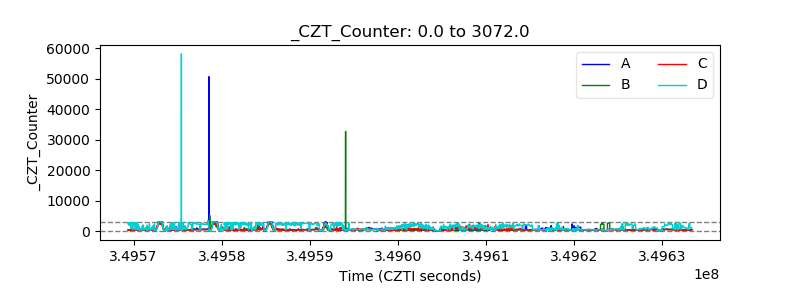 |
| +2.5 Volts monitor | 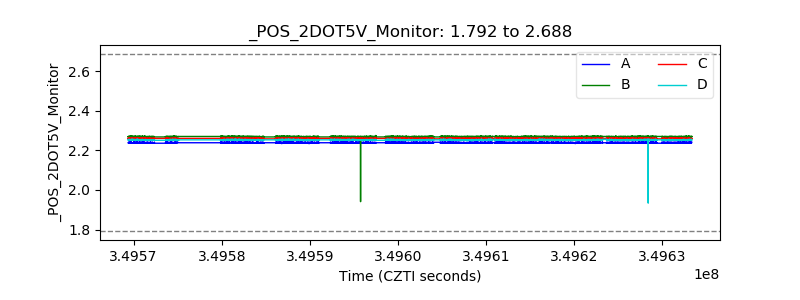 |
| +5 Volts monitor |  |
| _ROLL_ROT |  |
| _Roll_DEC |  |
| _Roll_RA |  |
| Veto Counter | 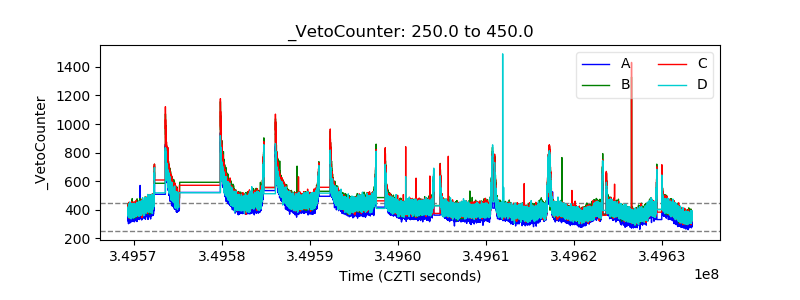 |