| Param | Original file | Final file |
|---|---|---|
| Filename | modeM0/AS1A10_103T08_9000004136cztM0_level2_bc.evt | modeM0/AS1A10_103T08_9000004136cztM0_level2_quad_clean.evt |
| Size (bytes) | 6,290,231,040 | 1,533,185,280 |
| Size | 5.9 GB | 1.4 GB |
| Events in quadrant A | 20,033,970 | 10,998,708 |
| Events in quadrant B | 22,984,109 | 11,102,016 |
| Events in quadrant C | 24,920,620 | 10,667,104 |
| Events in quadrant D | 117,022,703 | 8,061,669 |
| Mode SS | |||
|---|---|---|---|
| Quadrant | BADHDUFLAG | Total packets | Discarded packets |
| A | 0 | 1666 | 0 |
| B | 0 | 1666 | 0 |
| C | 0 | 1666 | 0 |
| D | 0 | 1666 | 0 |
| Mode M9 | |||
|---|---|---|---|
| Quadrant | BADHDUFLAG | Total packets | Discarded packets |
| A | 0 | 129 | 0 |
| B | 0 | 129 | 0 |
| C | 0 | 129 | 0 |
| D | 0 | 129 | 0 |
| Mode M0 | |||
|---|---|---|---|
| Quadrant | BADHDUFLAG | Total packets | Discarded packets |
| A | 0 | 176218 | 0 |
| B | 0 | 189829 | 0 |
| C | 0 | 194869 | 0 |
| D | 0 | 490527 | 0 |
| Quadrant | Total seconds | Saturated seconds | Saturation percentage |
|---|---|---|---|
| A | 81585 | 1375 | 1.685359% |
| B | 81586 | 2851 | 3.494472% |
| C | 81586 | 2208 | 2.706347% |
| D | 81586 | 42440 | 52.018729% |
Noise dominated data is calculated using 1-second bins in cleaned event files. If a bin has >2000 counts, and if more than 50% of those come from <1% of pixels, then it is considered to be noise-dominated and hence unusable.
| Quadrant | # 1 sec bins | Bins with >0 counts | Bins with >2000 counts | High rate bins dominated by noise | Noise dominated (total time) | Noise dominated (detector-on time) | Marked lightcurve |
|---|---|---|---|---|---|---|---|
| A | 94646 | 81575 | 49 | 49 | 0.05% | 0.06% | 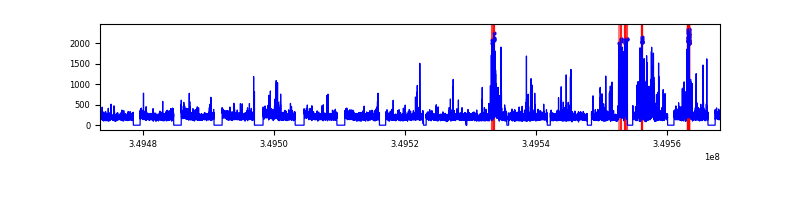 |
| B | 94647 | 81575 | 83 | 83 | 0.09% | 0.10% | 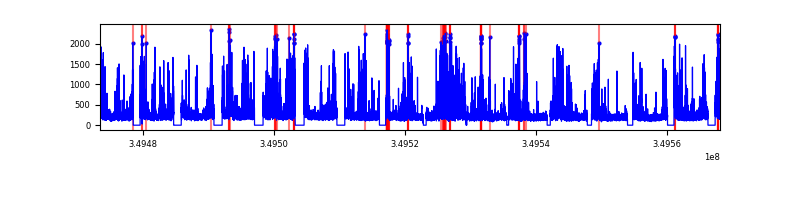 |
| C | 94647 | 81577 | 4 | 4 | 0.00% | 0.00% |  |
| D | 94646 | 81568 | 24261 | 24261 | 25.63% | 29.74% |  |
Top three noisy pixels from each quadrant. If the there are fewer than three noisy pixels in the level2.evt file, extra rows are filled as -1
| Pixel properties | Quadrant properties | ||||||
|---|---|---|---|---|---|---|---|
| Quadrant | DetID | PixID | Counts | Sigma | Mean | Median | Sigma |
| A | 14 | 235 | 2535293 | 2644.51 | 4425 | 4361 | 957.0 |
| A | 5 | 98 | 157739 | 160.26 | 4425 | 4361 | 957.0 |
| A | 13 | 254 | 152591 | 154.88 | 4425 | 4361 | 957.0 |
| B | 5 | 172 | 2091752 | 2505.94 | 4445 | 4346 | 833.0 |
| B | 5 | 255 | 1614635 | 1933.16 | 4445 | 4346 | 833.0 |
| B | 10 | 246 | 1357719 | 1624.73 | 4445 | 4346 | 833.0 |
| C | 3 | 233 | 8166762 | 8019.86 | 4273 | 4266 | 1017.8 |
| C | 15 | 208 | 124275 | 117.91 | 4273 | 4266 | 1017.8 |
| C | 14 | 254 | 63227 | 57.93 | 4273 | 4266 | 1017.8 |
| D | 8 | 195 | 77863508 | 94989.08 | 3539 | 3426 | 819.7 |
| D | 1 | 52 | 21066588 | 25697.0 | 3539 | 3426 | 819.7 |
| D | 13 | 104 | 1890629 | 2302.38 | 3539 | 3426 | 819.7 |
Histogram calculated using DETX and DETY for each event in the final _common_clean file
| Quadrant A |  |
 |
Quadrant B |
|---|---|---|---|
| Quadrant D | 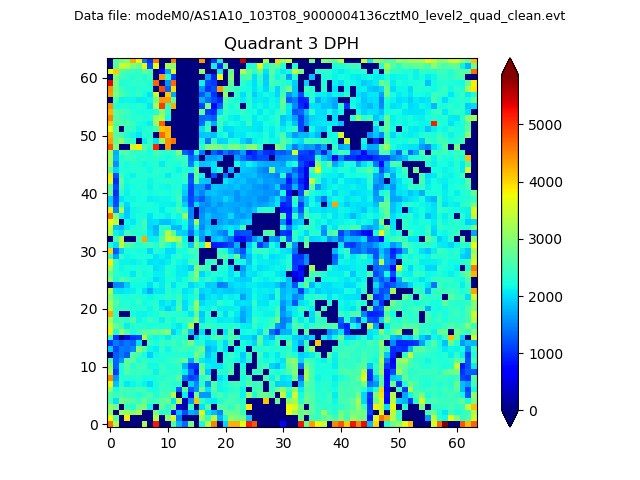 |
 |
Quadrant C |
| Plot type | Count rate plots | Images |
|---|---|---|
| Comparison with Poisson distribution Blue bars denote a histogram of data divided into 1 sec bins. Red curve is a Poisson curve with rate = median count rate of data. |
 |
 |
| Quadrant-wise count rates Data is divided into 100 sec bins |
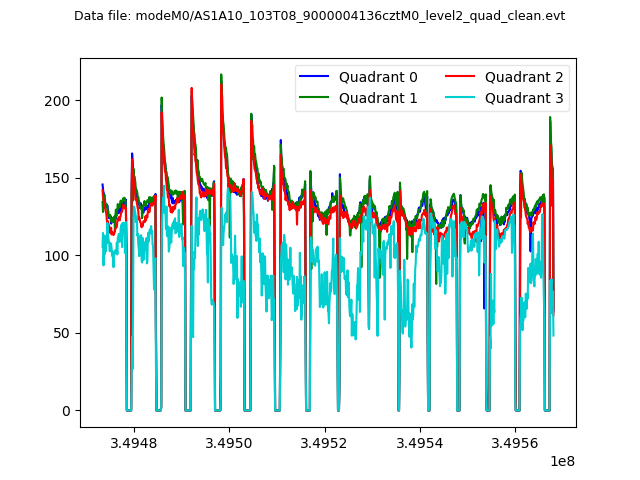 |
|
| Module-wise count rates for Quadrant A Data is divided into 100 sec bins |
 |
 |
| Module-wise count rates for Quadrant B Data is divided into 100 sec bins |
 |
 |
| Module-wise count rates for Quadrant C Data is divided into 100 sec bins |
 |
 |
| Module-wise count rates for Quadrant D Data is divided into 100 sec bins |
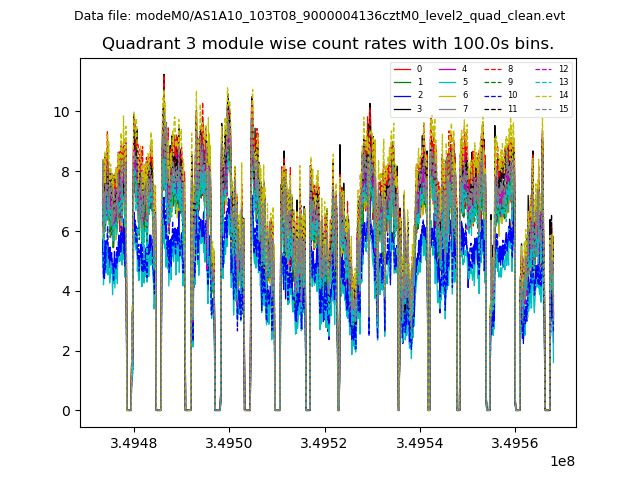 |
 |
| Parameter | Plot |
|---|---|
| CZT HV Monitor |  |
| D_VDD |  |
| Temperature 1 |  |
| Veto HV Monitor |  |
| Veto LLD |  |
| Alpha Counter |  |
| _CPM_Rate |  |
| CZT Counter |  |
| +2.5 Volts monitor |  |
| +5 Volts monitor |  |
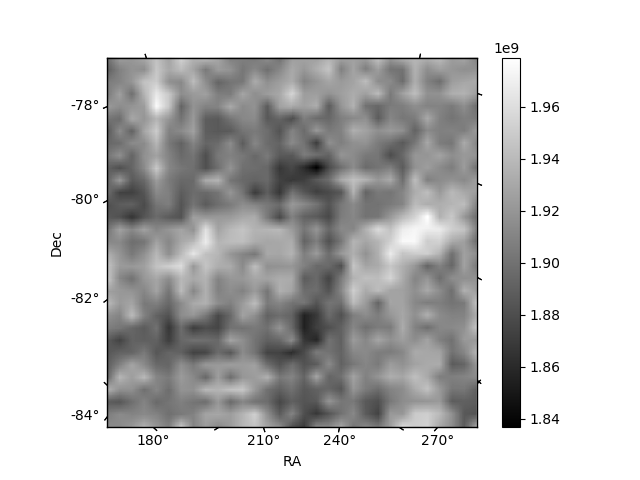
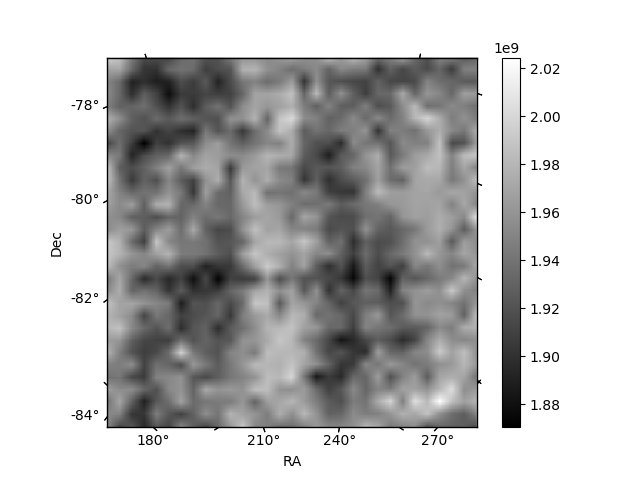
| _ROLL_ROT |  |
| _Roll_DEC |  |
| _Roll_RA | 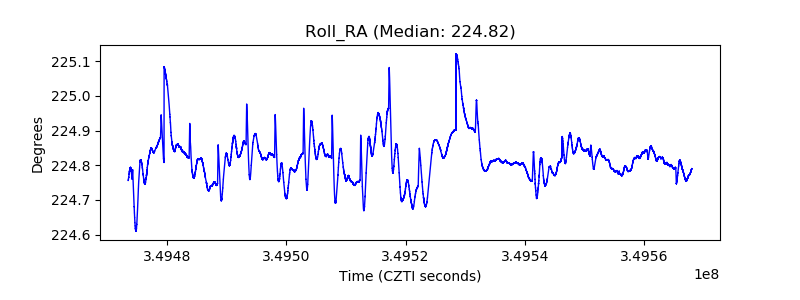 |
| Veto Counter |  |