| Param | Original file | Final file |
|---|---|---|
| Filename | modeM0/AS1A10_121T01_9000004134cztM0_level2_bc.evt | modeM0/AS1A10_121T01_9000004134cztM0_level2_quad_clean.evt |
| Size (bytes) | 13,482,296,640 | 3,200,005,440 |
| Size | 12.6 GB | 3.0 GB |
| Events in quadrant A | 48,561,090 | 21,692,219 |
| Events in quadrant B | 52,292,036 | 22,225,804 |
| Events in quadrant C | 83,304,953 | 20,716,566 |
| Events in quadrant D | 210,296,789 | 18,281,118 |
| Mode M9 | |||
|---|---|---|---|
| Quadrant | BADHDUFLAG | Total packets | Discarded packets |
| A | 0 | 310 | 0 |
| B | 0 | 310 | 0 |
| C | 0 | 310 | 0 |
| D | 0 | 310 | 0 |
| Mode M0 | |||
|---|---|---|---|
| Quadrant | BADHDUFLAG | Total packets | Discarded packets |
| A | 0 | 437691 | 0 |
| B | 0 | 456839 | 0 |
| C | 0 | 578843 | 0 |
| D | 0 | 987248 | 0 |
| Mode SS | |||
|---|---|---|---|
| Quadrant | BADHDUFLAG | Total packets | Discarded packets |
| A | 0 | 4170 | 0 |
| B | 0 | 4170 | 0 |
| C | 0 | 4170 | 0 |
| D | 0 | 4170 | 0 |
| Quadrant | Total seconds | Saturated seconds | Saturation percentage |
|---|---|---|---|
| A | 204272 | 3626 | 1.775084% |
| B | 204272 | 5960 | 2.917678% |
| C | 204272 | 16468 | 8.061800% |
| D | 204272 | 57946 | 28.367079% |
Noise dominated data is calculated using 1-second bins in cleaned event files. If a bin has >2000 counts, and if more than 50% of those come from <1% of pixels, then it is considered to be noise-dominated and hence unusable.
| Quadrant | # 1 sec bins | Bins with >0 counts | Bins with >2000 counts | High rate bins dominated by noise | Noise dominated (total time) | Noise dominated (detector-on time) | Marked lightcurve |
|---|---|---|---|---|---|---|---|
| A | 235658 | 204246 | 174 | 174 | 0.07% | 0.09% |  |
| B | 235658 | 204239 | 102 | 102 | 0.04% | 0.05% | 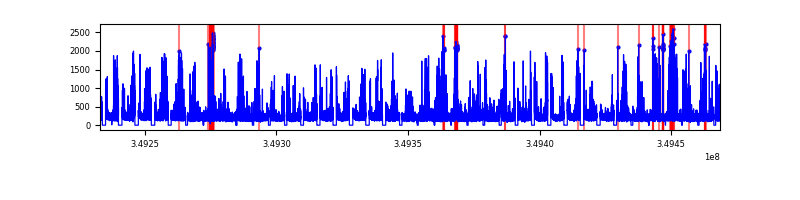 |
| C | 235658 | 204224 | 213 | 213 | 0.09% | 0.10% | 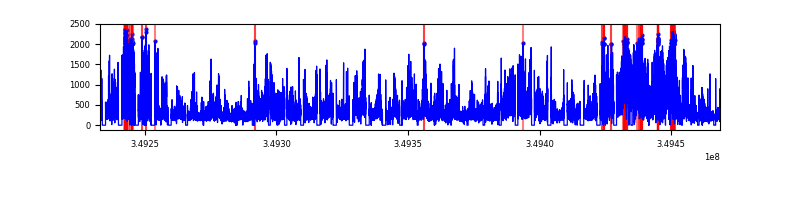 |
| D | 235658 | 204233 | 24431 | 24431 | 10.37% | 11.96% | 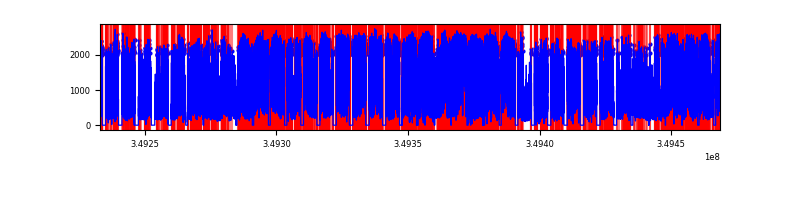 |
Top three noisy pixels from each quadrant. If the there are fewer than three noisy pixels in the level2.evt file, extra rows are filled as -1
| Pixel properties | Quadrant properties | ||||||
|---|---|---|---|---|---|---|---|
| Quadrant | DetID | PixID | Counts | Sigma | Mean | Median | Sigma |
| A | 14 | 235 | 3698919 | 1530.27 | 11107 | 10950 | 2410.0 |
| A | 6 | 16 | 563773 | 229.39 | 11107 | 10950 | 2410.0 |
| A | 15 | 174 | 400183 | 161.51 | 11107 | 10950 | 2410.0 |
| B | 5 | 172 | 4238607 | 2017.64 | 11228 | 11007 | 2095.3 |
| B | 5 | 255 | 1630615 | 772.97 | 11228 | 11007 | 2095.3 |
| B | 10 | 245 | 954658 | 450.36 | 11228 | 11007 | 2095.3 |
| C | 3 | 233 | 37050827 | 14564.87 | 10601 | 10578 | 2543.1 |
| C | 4 | 254 | 4062242 | 1593.18 | 10601 | 10578 | 2543.1 |
| C | 14 | 254 | 804501 | 312.18 | 10601 | 10578 | 2543.1 |
| D | 8 | 195 | 99696024 | 42804.18 | 9926 | 9603 | 2328.9 |
| D | 1 | 52 | 52023606 | 22334.2 | 9926 | 9603 | 2328.9 |
| D | 13 | 104 | 9251985 | 3968.57 | 9926 | 9603 | 2328.9 |
Histogram calculated using DETX and DETY for each event in the final _common_clean file
| Quadrant A | 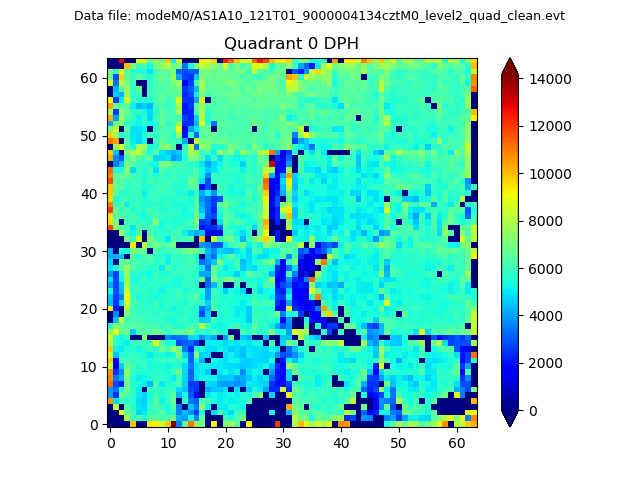 |
 |
Quadrant B |
|---|---|---|---|
| Quadrant D |  |
 |
Quadrant C |
| Plot type | Count rate plots | Images |
|---|---|---|
| Comparison with Poisson distribution Blue bars denote a histogram of data divided into 1 sec bins. Red curve is a Poisson curve with rate = median count rate of data. |
 |
 |
| Quadrant-wise count rates Data is divided into 100 sec bins |
 |
|
| Module-wise count rates for Quadrant A Data is divided into 100 sec bins |
 |
 |
| Module-wise count rates for Quadrant B Data is divided into 100 sec bins |
 |
 |
| Module-wise count rates for Quadrant C Data is divided into 100 sec bins |
 |
 |
| Module-wise count rates for Quadrant D Data is divided into 100 sec bins |
 |
 |
| Parameter | Plot |
|---|---|
| CZT HV Monitor |  |
| D_VDD |  |
| Temperature 1 | 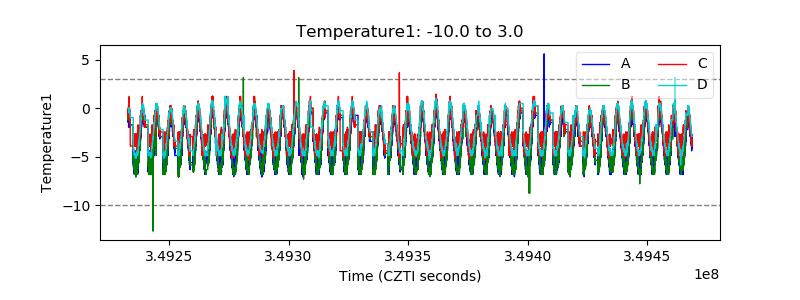 |
| Veto HV Monitor |  |
| Veto LLD |  |
| Alpha Counter |  |
| _CPM_Rate | 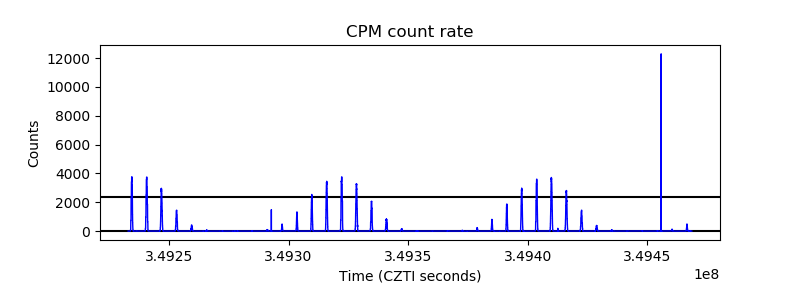 |
| CZT Counter |  |
| +2.5 Volts monitor | 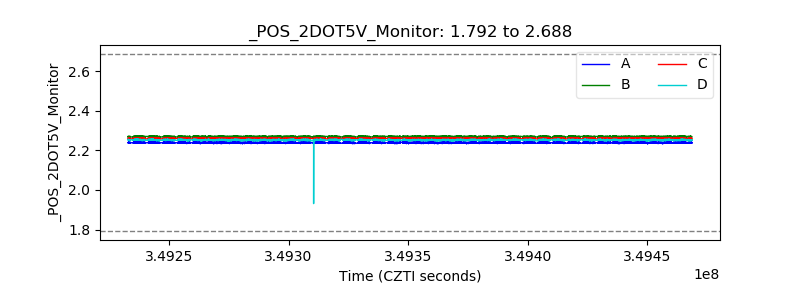 |
| +5 Volts monitor |  |
| _ROLL_ROT | 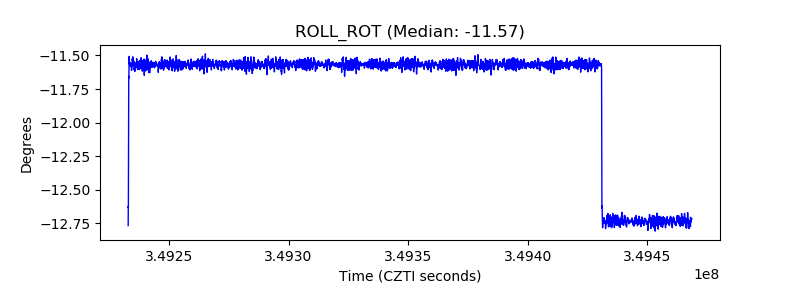 |
| _Roll_DEC |  |
| _Roll_RA |  |
| Veto Counter |  |