| Param | Original file | Final file |
|---|---|---|
| Filename | modeM0/AS1A10_103T01_9000004132cztM0_level2_bc.evt | modeM0/AS1A10_103T01_9000004132cztM0_level2_quad_clean.evt |
| Size (bytes) | 4,313,897,280 | 1,132,220,160 |
| Size | 4.0 GB | 1.1 GB |
| Events in quadrant A | 19,636,116 | 7,344,906 |
| Events in quadrant B | 19,832,600 | 7,548,677 |
| Events in quadrant C | 27,370,794 | 7,065,081 |
| Events in quadrant D | 58,215,136 | 6,693,668 |
| Mode SS | |||
|---|---|---|---|
| Quadrant | BADHDUFLAG | Total packets | Discarded packets |
| A | 0 | 1674 | 0 |
| B | 0 | 1674 | 0 |
| C | 0 | 1674 | 0 |
| D | 0 | 1674 | 0 |
| Mode M0 | |||
|---|---|---|---|
| Quadrant | BADHDUFLAG | Total packets | Discarded packets |
| A | 0 | 177631 | 0 |
| B | 0 | 179273 | 0 |
| C | 0 | 213532 | 0 |
| D | 0 | 313580 | 0 |
| Mode M9 | |||
|---|---|---|---|
| Quadrant | BADHDUFLAG | Total packets | Discarded packets |
| A | 0 | 133 | 0 |
| B | 0 | 133 | 0 |
| C | 0 | 133 | 0 |
| D | 0 | 133 | 0 |
| Quadrant | Total seconds | Saturated seconds | Saturation percentage |
|---|---|---|---|
| A | 82276 | 1333 | 1.620157% |
| B | 82276 | 1697 | 2.062570% |
| C | 82276 | 5619 | 6.829452% |
| D | 82276 | 10812 | 13.141135% |
Noise dominated data is calculated using 1-second bins in cleaned event files. If a bin has >2000 counts, and if more than 50% of those come from <1% of pixels, then it is considered to be noise-dominated and hence unusable.
| Quadrant | # 1 sec bins | Bins with >0 counts | Bins with >2000 counts | High rate bins dominated by noise | Noise dominated (total time) | Noise dominated (detector-on time) | Marked lightcurve |
|---|---|---|---|---|---|---|---|
| A | 95381 | 82266 | 10 | 10 | 0.01% | 0.01% |  |
| B | 95381 | 82260 | 36 | 36 | 0.04% | 0.04% |  |
| C | 95381 | 82235 | 50 | 50 | 0.05% | 0.06% | 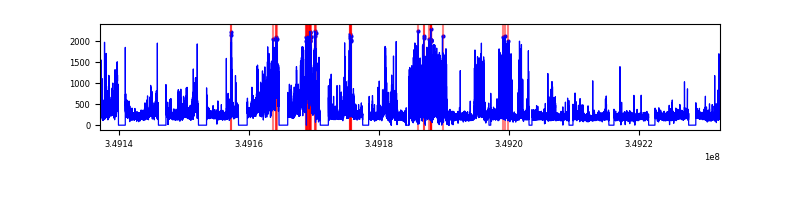 |
| D | 95381 | 82261 | 2643 | 2643 | 2.77% | 3.21% | 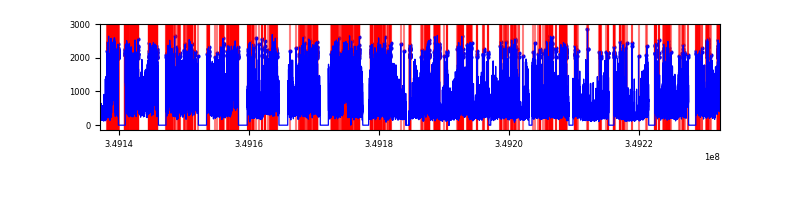 |
Top three noisy pixels from each quadrant. If the there are fewer than three noisy pixels in the level2.evt file, extra rows are filled as -1
| Pixel properties | Quadrant properties | ||||||
|---|---|---|---|---|---|---|---|
| Quadrant | DetID | PixID | Counts | Sigma | Mean | Median | Sigma |
| A | 14 | 235 | 1487887 | 1550.89 | 4467 | 4388 | 956.5 |
| A | 15 | 174 | 464571 | 481.09 | 4467 | 4388 | 956.5 |
| A | 13 | 254 | 147906 | 150.04 | 4467 | 4388 | 956.5 |
| B | 5 | 172 | 585846 | 683.15 | 4533 | 4429 | 851.1 |
| B | 10 | 246 | 526083 | 612.93 | 4533 | 4429 | 851.1 |
| B | 5 | 255 | 492627 | 573.62 | 4533 | 4429 | 851.1 |
| C | 3 | 233 | 7002133 | 6871.87 | 4290 | 4273 | 1018.3 |
| C | 4 | 254 | 3226608 | 3164.32 | 4290 | 4273 | 1018.3 |
| C | 15 | 208 | 298701 | 289.13 | 4290 | 4273 | 1018.3 |
| D | 1 | 52 | 21640423 | 22588.8 | 4192 | 4058 | 957.8 |
| D | 8 | 195 | 11641690 | 12149.92 | 4192 | 4058 | 957.8 |
| D | 13 | 104 | 4119751 | 4296.87 | 4192 | 4058 | 957.8 |
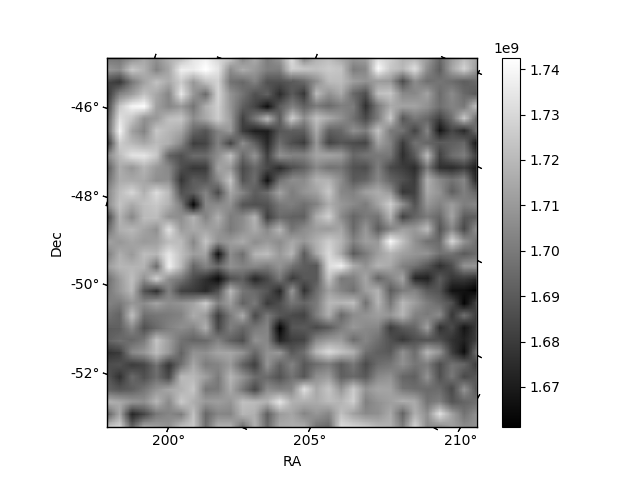
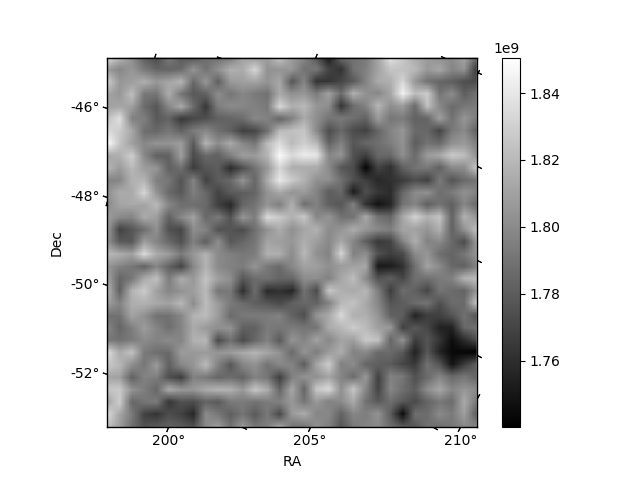
Histogram calculated using DETX and DETY for each event in the final _common_clean file
| Quadrant A | 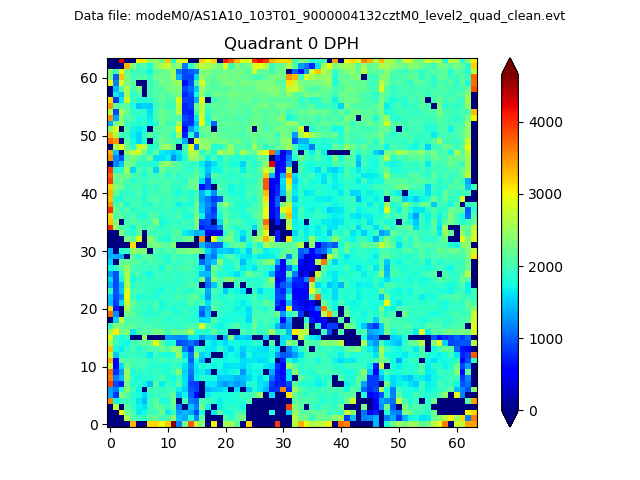 |
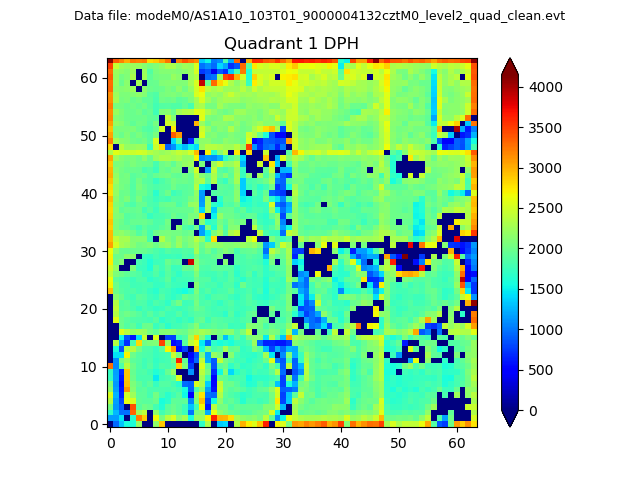 |
Quadrant B |
|---|---|---|---|
| Quadrant D |  |
 |
Quadrant C |
| Plot type | Count rate plots | Images |
|---|---|---|
| Comparison with Poisson distribution Blue bars denote a histogram of data divided into 1 sec bins. Red curve is a Poisson curve with rate = median count rate of data. |
 |
 |
| Quadrant-wise count rates Data is divided into 100 sec bins |
 |
|
| Module-wise count rates for Quadrant A Data is divided into 100 sec bins |
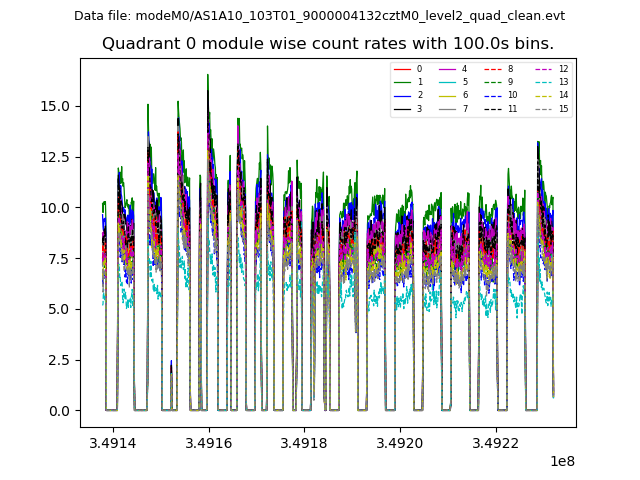 |
 |
| Module-wise count rates for Quadrant B Data is divided into 100 sec bins |
 |
 |
| Module-wise count rates for Quadrant C Data is divided into 100 sec bins |
 |
 |
| Module-wise count rates for Quadrant D Data is divided into 100 sec bins |
 |
 |
| Parameter | Plot |
|---|---|
| CZT HV Monitor | 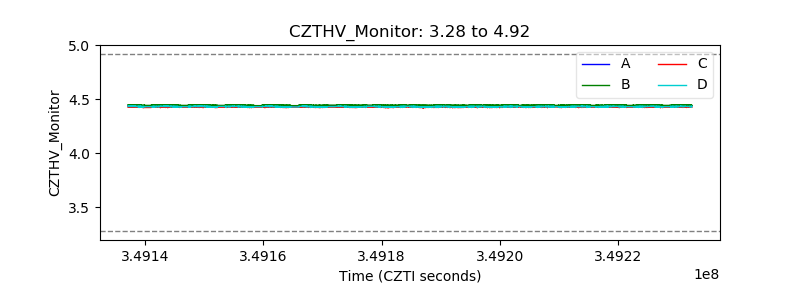 |
| D_VDD |  |
| Temperature 1 | 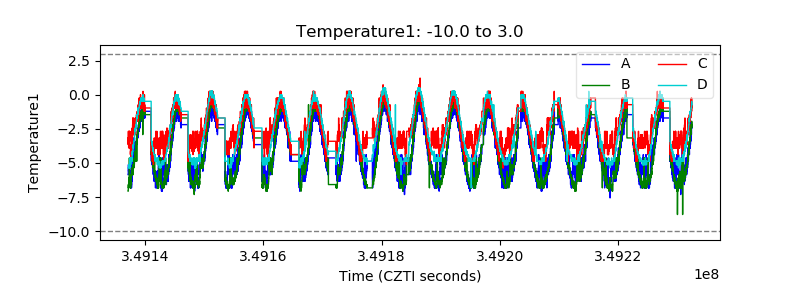 |
| Veto HV Monitor | 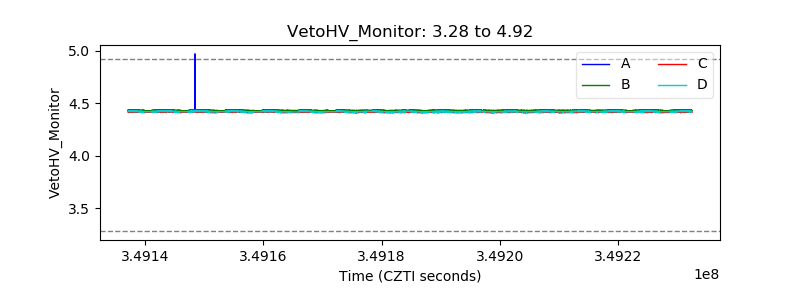 |
| Veto LLD | 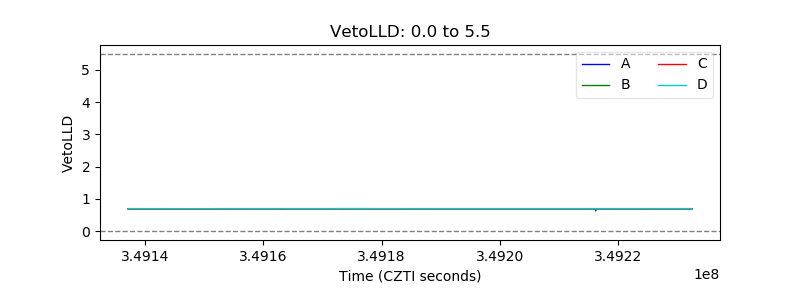 |
| Alpha Counter |  |
| _CPM_Rate | 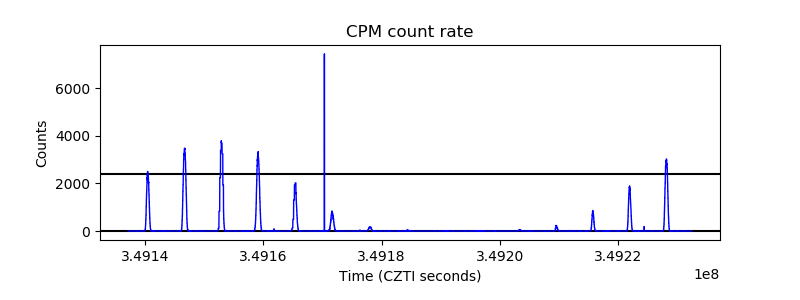 |
| CZT Counter |  |
| +2.5 Volts monitor | 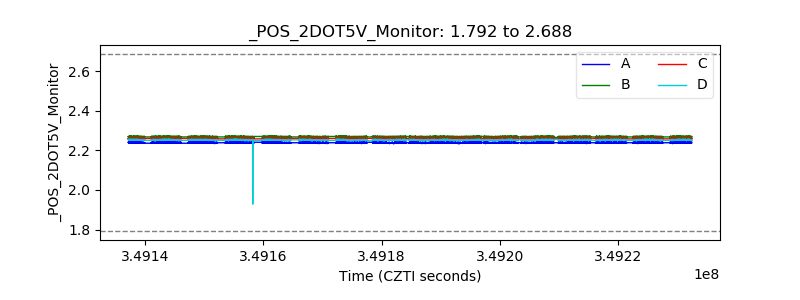 |
| +5 Volts monitor | 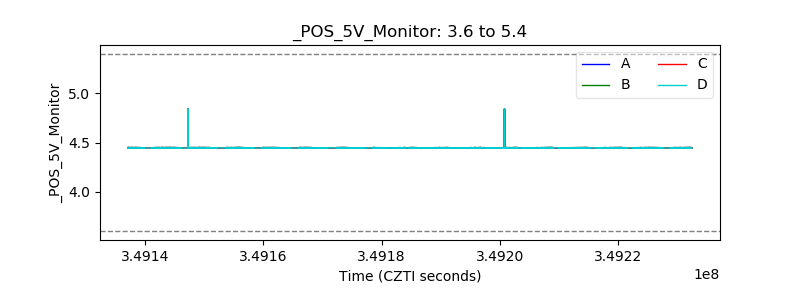 |
| _ROLL_ROT |  |
| _Roll_DEC |  |
| _Roll_RA | 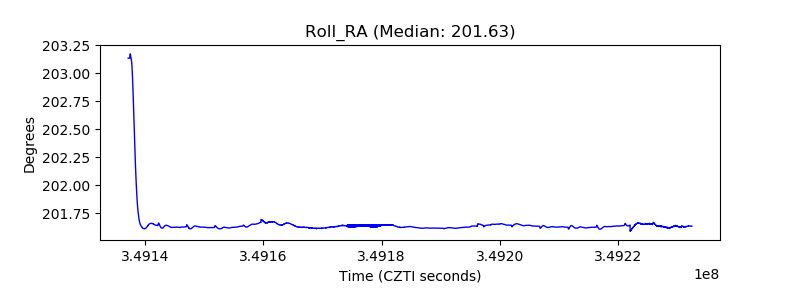 |
| Veto Counter |  |