| Param | Original file | Final file |
|---|---|---|
| Filename | modeM0/AS1C05_019T04_9000004130cztM0_level2_bc.evt | modeM0/AS1C05_019T04_9000004130cztM0_level2_quad_clean.evt |
| Size (bytes) | 5,320,805,760 | 1,578,957,120 |
| Size | 5.0 GB | 1.5 GB |
| Events in quadrant A | 20,364,713 | 10,794,746 |
| Events in quadrant B | 21,133,226 | 10,948,828 |
| Events in quadrant C | 42,823,541 | 10,136,599 |
| Events in quadrant D | 70,273,179 | 9,339,716 |
| Mode SS | |||
|---|---|---|---|
| Quadrant | BADHDUFLAG | Total packets | Discarded packets |
| A | 0 | 1960 | 0 |
| B | 0 | 1960 | 0 |
| C | 0 | 1960 | 0 |
| D | 0 | 1960 | 0 |
| Mode M9 | |||
|---|---|---|---|
| Quadrant | BADHDUFLAG | Total packets | Discarded packets |
| A | 0 | 141 | 0 |
| B | 0 | 141 | 0 |
| C | 0 | 141 | 0 |
| D | 0 | 141 | 0 |
| Mode M0 | |||
|---|---|---|---|
| Quadrant | BADHDUFLAG | Total packets | Discarded packets |
| A | 0 | 198249 | 0 |
| B | 0 | 202305 | 0 |
| C | 0 | 276325 | 0 |
| D | 0 | 371193 | 0 |
| Quadrant | Total seconds | Saturated seconds | Saturation percentage |
|---|---|---|---|
| A | 96327 | 845 | 0.877220% |
| B | 96327 | 1389 | 1.441963% |
| C | 96327 | 6700 | 6.955475% |
| D | 96327 | 18489 | 19.193995% |
Noise dominated data is calculated using 1-second bins in cleaned event files. If a bin has >2000 counts, and if more than 50% of those come from <1% of pixels, then it is considered to be noise-dominated and hence unusable.
| Quadrant | # 1 sec bins | Bins with >0 counts | Bins with >2000 counts | High rate bins dominated by noise | Noise dominated (total time) | Noise dominated (detector-on time) | Marked lightcurve |
|---|---|---|---|---|---|---|---|
| A | 110368 | 96322 | 14 | 14 | 0.01% | 0.01% |  |
| B | 110368 | 96313 | 30 | 30 | 0.03% | 0.03% |  |
| C | 110368 | 96310 | 276 | 276 | 0.25% | 0.29% |  |
| D | 110368 | 96306 | 7023 | 7023 | 6.36% | 7.29% | 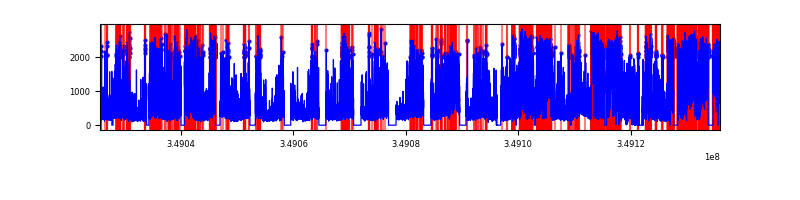 |
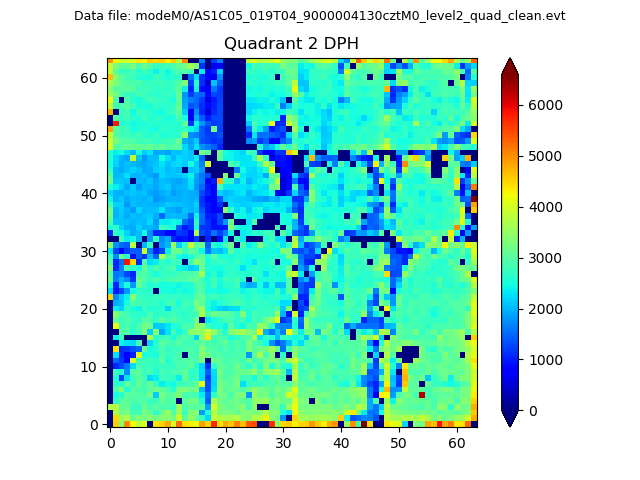
Top three noisy pixels from each quadrant. If the there are fewer than three noisy pixels in the level2.evt file, extra rows are filled as -1
| Pixel properties | Quadrant properties | ||||||
|---|---|---|---|---|---|---|---|
| Quadrant | DetID | PixID | Counts | Sigma | Mean | Median | Sigma |
| A | 15 | 174 | 209436 | 184.84 | 5132 | 5054 | 1105.7 |
| A | 13 | 254 | 164881 | 144.54 | 5132 | 5054 | 1105.7 |
| A | 5 | 98 | 112810 | 97.45 | 5132 | 5054 | 1105.7 |
| B | 4 | 80 | 665461 | 680.84 | 5149 | 5036 | 970.0 |
| B | 5 | 255 | 235140 | 237.22 | 5149 | 5036 | 970.0 |
| B | 10 | 245 | 132094 | 130.98 | 5149 | 5036 | 970.0 |
| C | 3 | 233 | 23537305 | 20775.16 | 4785 | 4775 | 1132.7 |
| C | 15 | 208 | 369815 | 322.27 | 4785 | 4775 | 1132.7 |
| C | 14 | 254 | 302737 | 263.05 | 4785 | 4775 | 1132.7 |
| D | 8 | 195 | 28923186 | 27101.35 | 4599 | 4451 | 1067.1 |
| D | 1 | 52 | 19381561 | 18159.36 | 4599 | 4451 | 1067.1 |
| D | 13 | 104 | 2217267 | 2073.75 | 4599 | 4451 | 1067.1 |
Histogram calculated using DETX and DETY for each event in the final _common_clean file
| Quadrant A | 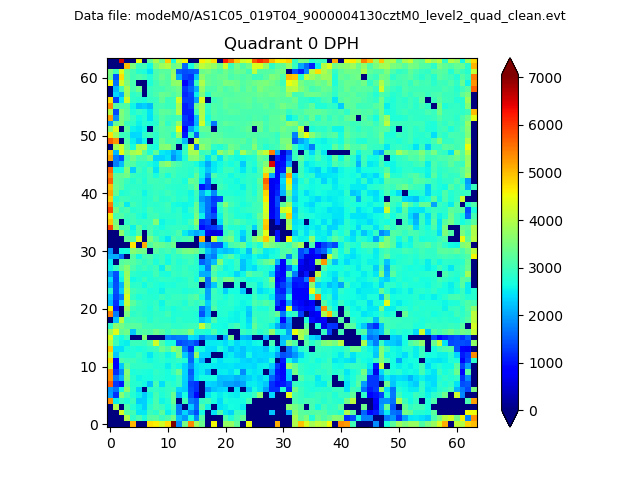 |
 |
Quadrant B |
|---|---|---|---|
| Quadrant D |  |
 |
Quadrant C |
| Plot type | Count rate plots | Images |
|---|---|---|
| Comparison with Poisson distribution Blue bars denote a histogram of data divided into 1 sec bins. Red curve is a Poisson curve with rate = median count rate of data. |
 |
 |
| Quadrant-wise count rates Data is divided into 100 sec bins |
 |
|
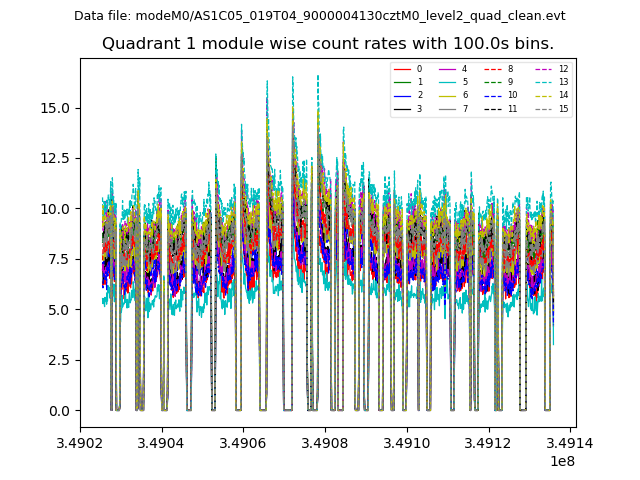
| Module-wise count rates for Quadrant A Data is divided into 100 sec bins |
 |
 |
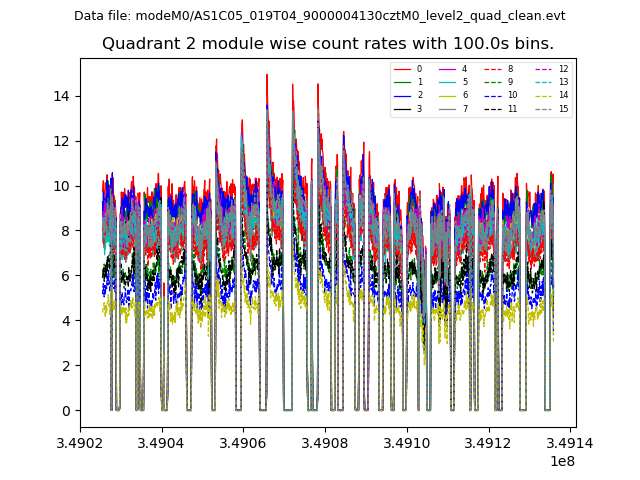
| Module-wise count rates for Quadrant B Data is divided into 100 sec bins |
 |
 |
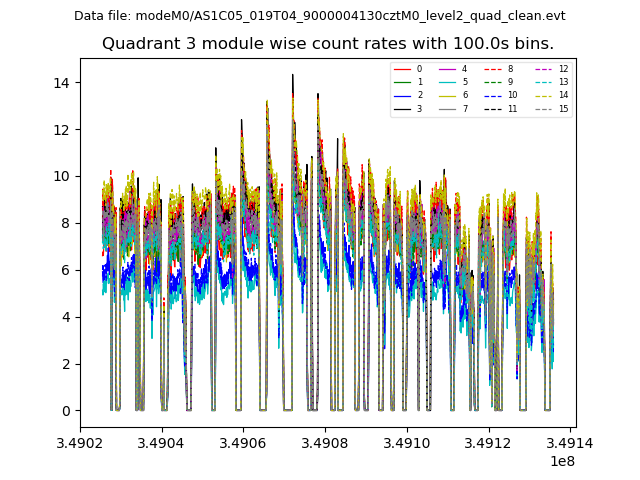
| Module-wise count rates for Quadrant C Data is divided into 100 sec bins |
 |
 |
| Module-wise count rates for Quadrant D Data is divided into 100 sec bins |
 |
 |
| Parameter | Plot |
|---|---|
| CZT HV Monitor |  |
| D_VDD |  |
| Temperature 1 |  |
| Veto HV Monitor |  |
| Veto LLD | 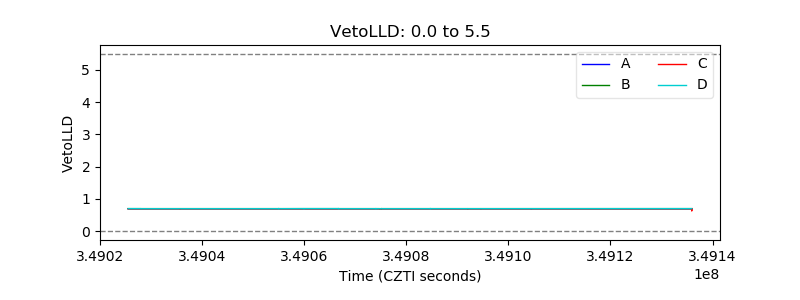 |
| Alpha Counter | 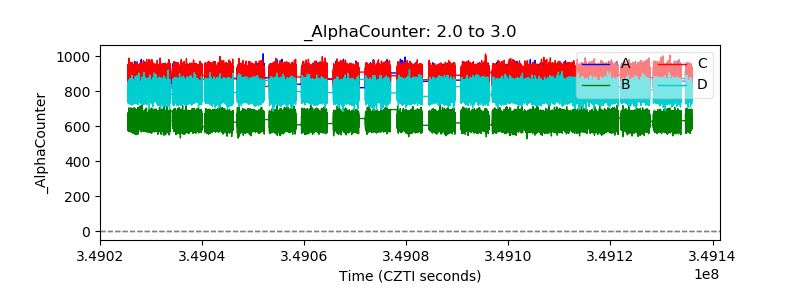 |
| _CPM_Rate |  |
| CZT Counter |  |
| +2.5 Volts monitor |  |
| +5 Volts monitor |  |
| _ROLL_ROT |  |
| _Roll_DEC |  |
| _Roll_RA |  |
| Veto Counter |  |