| Param | Original file | Final file |
|---|---|---|
| Filename | modeM0/AS1A10_123T08_9000004126cztM0_level2_bc.evt | modeM0/AS1A10_123T08_9000004126cztM0_level2_quad_clean.evt |
| Size (bytes) | 4,156,208,640 | 1,064,856,960 |
| Size | 3.9 GB | 1015.5 MB |
| Events in quadrant A | 16,996,180 | 6,968,500 |
| Events in quadrant B | 19,017,857 | 7,043,588 |
| Events in quadrant C | 44,217,389 | 6,562,390 |
| Events in quadrant D | 40,506,069 | 6,494,997 |
| Mode M0 | |||
|---|---|---|---|
| Quadrant | BADHDUFLAG | Total packets | Discarded packets |
| A | 0 | 158640 | 0 |
| B | 0 | 166875 | 0 |
| C | 0 | 249231 | 0 |
| D | 0 | 238355 | 0 |
| Mode SS | |||
|---|---|---|---|
| Quadrant | BADHDUFLAG | Total packets | Discarded packets |
| A | 0 | 1542 | 0 |
| B | 0 | 1542 | 0 |
| C | 0 | 1542 | 0 |
| D | 0 | 1542 | 0 |
| Mode M9 | |||
|---|---|---|---|
| Quadrant | BADHDUFLAG | Total packets | Discarded packets |
| A | 0 | 118 | 0 |
| B | 0 | 118 | 0 |
| C | 0 | 118 | 0 |
| D | 0 | 118 | 0 |
| Quadrant | Total seconds | Saturated seconds | Saturation percentage |
|---|---|---|---|
| A | 75588 | 1050 | 1.389109% |
| B | 75588 | 1607 | 2.125999% |
| C | 75588 | 7865 | 10.405091% |
| D | 75588 | 4721 | 6.245700% |
Noise dominated data is calculated using 1-second bins in cleaned event files. If a bin has >2000 counts, and if more than 50% of those come from <1% of pixels, then it is considered to be noise-dominated and hence unusable.
| Quadrant | # 1 sec bins | Bins with >0 counts | Bins with >2000 counts | High rate bins dominated by noise | Noise dominated (total time) | Noise dominated (detector-on time) | Marked lightcurve |
|---|---|---|---|---|---|---|---|
| A | 87453 | 75577 | 129 | 129 | 0.15% | 0.17% |  |
| B | 87453 | 75575 | 40 | 40 | 0.05% | 0.05% |  |
| C | 87453 | 75576 | 697 | 697 | 0.80% | 0.92% |  |
| D | 87453 | 75581 | 1014 | 1014 | 1.16% | 1.34% | 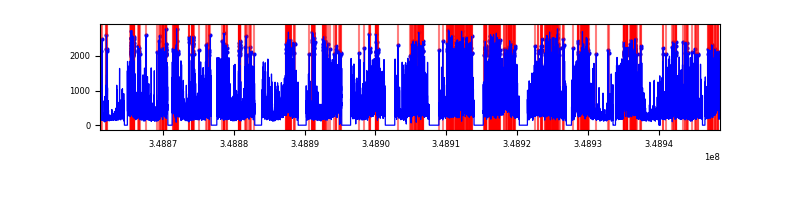 |
Top three noisy pixels from each quadrant. If the there are fewer than three noisy pixels in the level2.evt file, extra rows are filled as -1
| Pixel properties | Quadrant properties | ||||||
|---|---|---|---|---|---|---|---|
| Quadrant | DetID | PixID | Counts | Sigma | Mean | Median | Sigma |
| A | 14 | 239 | 296648 | 332.33 | 4113 | 4048 | 880.5 |
| A | 15 | 174 | 265699 | 297.18 | 4113 | 4048 | 880.5 |
| A | 6 | 16 | 220427 | 245.76 | 4113 | 4048 | 880.5 |
| B | 5 | 255 | 1541201 | 2002.01 | 4107 | 4021 | 767.8 |
| B | 4 | 80 | 691760 | 895.7 | 4107 | 4021 | 767.8 |
| B | 10 | 245 | 585110 | 756.8 | 4107 | 4021 | 767.8 |
| C | 3 | 233 | 29288332 | 32624.41 | 3812 | 3802 | 897.6 |
| C | 14 | 254 | 126463 | 136.65 | 3812 | 3802 | 897.6 |
| C | 4 | 254 | 61323 | 64.08 | 3812 | 3802 | 897.6 |
| D | 8 | 195 | 13697646 | 15034.99 | 3934 | 3814 | 910.8 |
| D | 1 | 52 | 9683058 | 10627.22 | 3934 | 3814 | 910.8 |
| D | 12 | 233 | 1222990 | 1338.58 | 3934 | 3814 | 910.8 |
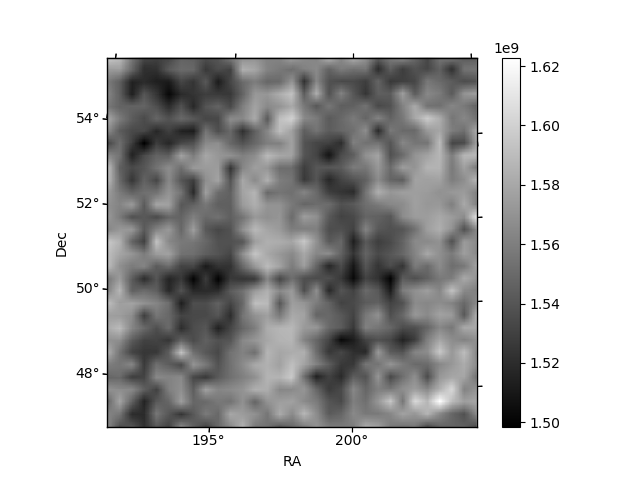
Histogram calculated using DETX and DETY for each event in the final _common_clean file
| Quadrant A |  |
 |
Quadrant B |
|---|---|---|---|
| Quadrant D |  |
 |
Quadrant C |
| Plot type | Count rate plots | Images |
|---|---|---|
| Comparison with Poisson distribution Blue bars denote a histogram of data divided into 1 sec bins. Red curve is a Poisson curve with rate = median count rate of data. |
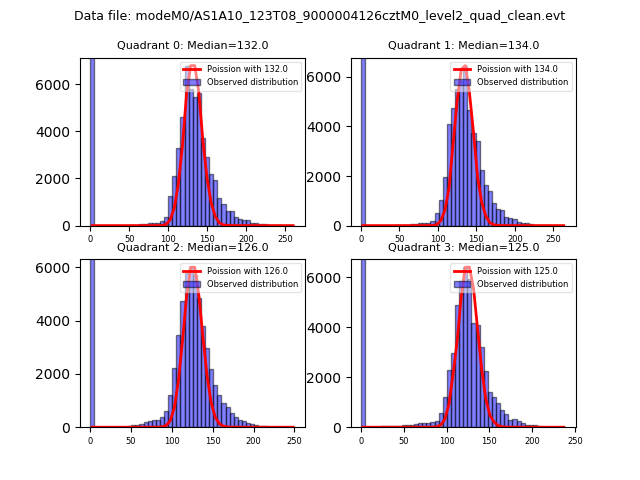 |
 |
| Quadrant-wise count rates Data is divided into 100 sec bins |
 |
|
| Module-wise count rates for Quadrant A Data is divided into 100 sec bins |
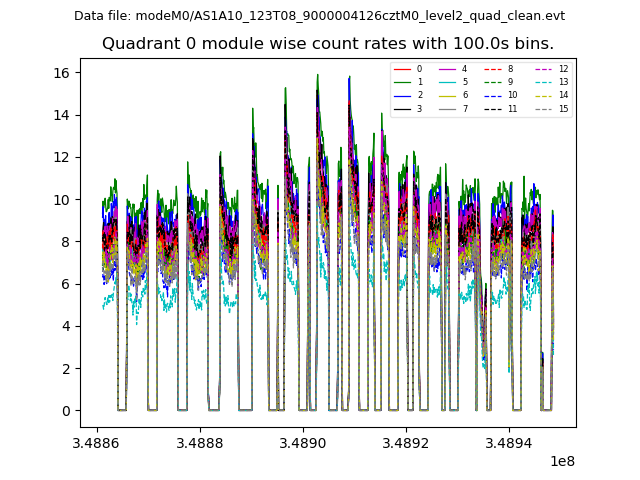 |
 |
| Module-wise count rates for Quadrant B Data is divided into 100 sec bins |
 |
 |
| Module-wise count rates for Quadrant C Data is divided into 100 sec bins |
 |
 |
| Module-wise count rates for Quadrant D Data is divided into 100 sec bins |
 |
 |
| Parameter | Plot |
|---|---|
| CZT HV Monitor |  |
| D_VDD | 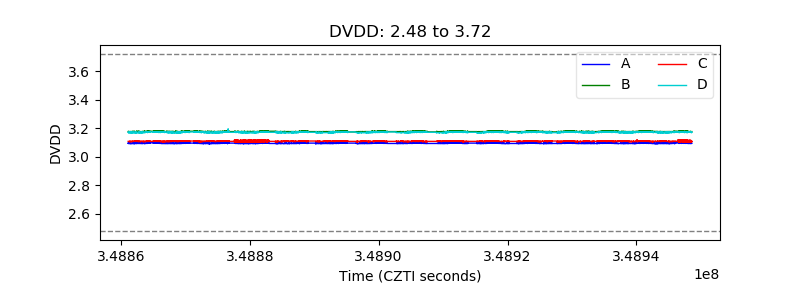 |
| Temperature 1 | 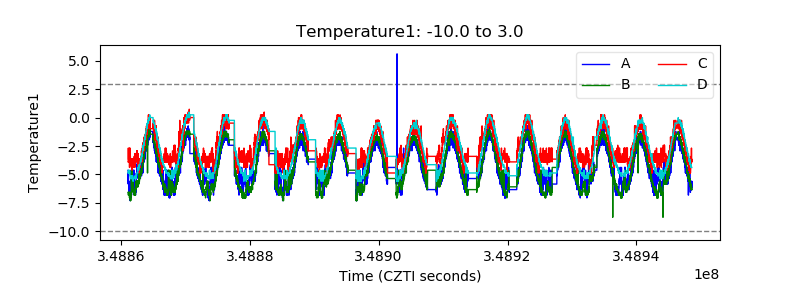 |
| Veto HV Monitor |  |
| Veto LLD |  |
| Alpha Counter |  |
| _CPM_Rate |  |
| CZT Counter |  |
| +2.5 Volts monitor |  |
| +5 Volts monitor |  |
| _ROLL_ROT |  |
| _Roll_DEC |  |
| _Roll_RA |  |
| Veto Counter | 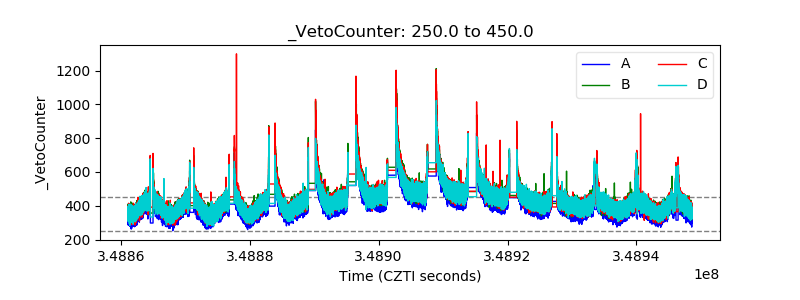 |