| Param | Original file | Final file |
|---|---|---|
| Filename | modeM0/AS1A10_123T07_9000004124cztM0_level2_bc.evt | modeM0/AS1A10_123T07_9000004124cztM0_level2_quad_clean.evt |
| Size (bytes) | 3,125,813,760 | 849,931,200 |
| Size | 2.9 GB | 810.6 MB |
| Events in quadrant A | 20,422,613 | 5,461,385 |
| Events in quadrant B | 17,279,942 | 5,541,418 |
| Events in quadrant C | 17,036,645 | 5,313,291 |
| Events in quadrant D | 35,577,971 | 5,042,823 |
| Mode M9 | |||
|---|---|---|---|
| Quadrant | BADHDUFLAG | Total packets | Discarded packets |
| A | 0 | 107 | 0 |
| B | 0 | 107 | 0 |
| C | 0 | 107 | 0 |
| D | 0 | 107 | 0 |
| Mode M0 | |||
|---|---|---|---|
| Quadrant | BADHDUFLAG | Total packets | Discarded packets |
| A | 0 | 158537 | 0 |
| B | 0 | 146140 | 0 |
| C | 0 | 146180 | 0 |
| D | 0 | 210342 | 0 |
| Mode SS | |||
|---|---|---|---|
| Quadrant | BADHDUFLAG | Total packets | Discarded packets |
| A | 0 | 1306 | 0 |
| B | 0 | 1306 | 0 |
| C | 0 | 1306 | 0 |
| D | 0 | 1306 | 0 |
| Quadrant | Total seconds | Saturated seconds | Saturation percentage |
|---|---|---|---|
| A | 63906 | 3332 | 5.213908% |
| B | 63906 | 1806 | 2.826026% |
| C | 63906 | 1975 | 3.090477% |
| D | 63906 | 5323 | 8.329421% |
Noise dominated data is calculated using 1-second bins in cleaned event files. If a bin has >2000 counts, and if more than 50% of those come from <1% of pixels, then it is considered to be noise-dominated and hence unusable.
| Quadrant | # 1 sec bins | Bins with >0 counts | Bins with >2000 counts | High rate bins dominated by noise | Noise dominated (total time) | Noise dominated (detector-on time) | Marked lightcurve |
|---|---|---|---|---|---|---|---|
| A | 74746 | 63893 | 201 | 201 | 0.27% | 0.31% |  |
| B | 74746 | 63894 | 84 | 84 | 0.11% | 0.13% |  |
| C | 74746 | 63898 | 8 | 8 | 0.01% | 0.01% |  |
| D | 74746 | 63896 | 548 | 548 | 0.73% | 0.86% |  |
Top three noisy pixels from each quadrant. If the there are fewer than three noisy pixels in the level2.evt file, extra rows are filled as -1
| Pixel properties | Quadrant properties | ||||||
|---|---|---|---|---|---|---|---|
| Quadrant | DetID | PixID | Counts | Sigma | Mean | Median | Sigma |
| A | 14 | 239 | 6551246 | 8724.4 | 3508 | 3456 | 750.5 |
| A | 15 | 174 | 170470 | 222.53 | 3508 | 3456 | 750.5 |
| A | 13 | 254 | 116053 | 150.03 | 3508 | 3456 | 750.5 |
| B | 5 | 255 | 2437900 | 3669.84 | 3546 | 3467 | 663.4 |
| B | 10 | 245 | 511695 | 766.14 | 3546 | 3467 | 663.4 |
| B | 4 | 80 | 448486 | 670.85 | 3546 | 3467 | 663.4 |
| C | 3 | 233 | 3884712 | 4882.64 | 3377 | 3367 | 794.9 |
| C | 14 | 254 | 153961 | 189.44 | 3377 | 3367 | 794.9 |
| C | 14 | 128 | 24712 | 26.85 | 3377 | 3367 | 794.9 |
| D | 8 | 195 | 9336724 | 12180.43 | 3377 | 3276 | 766.3 |
| D | 1 | 52 | 8067499 | 10524.05 | 3377 | 3276 | 766.3 |
| D | 12 | 233 | 3837693 | 5004.03 | 3377 | 3276 | 766.3 |
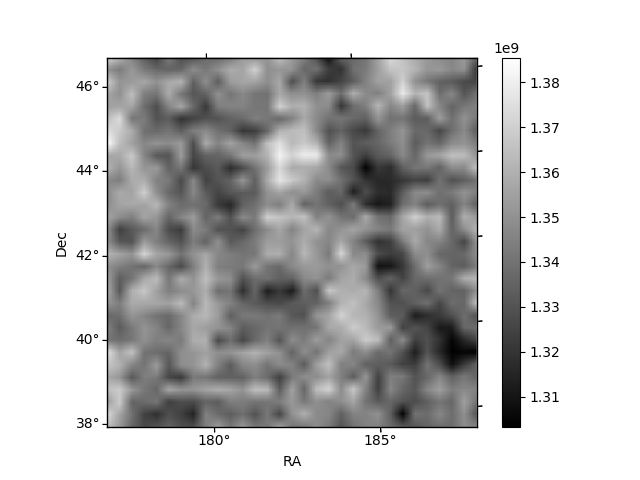
Histogram calculated using DETX and DETY for each event in the final _common_clean file
| Quadrant A |  |
 |
Quadrant B |
|---|---|---|---|
| Quadrant D |  |
 |
Quadrant C |
| Plot type | Count rate plots | Images |
|---|---|---|
| Comparison with Poisson distribution Blue bars denote a histogram of data divided into 1 sec bins. Red curve is a Poisson curve with rate = median count rate of data. |
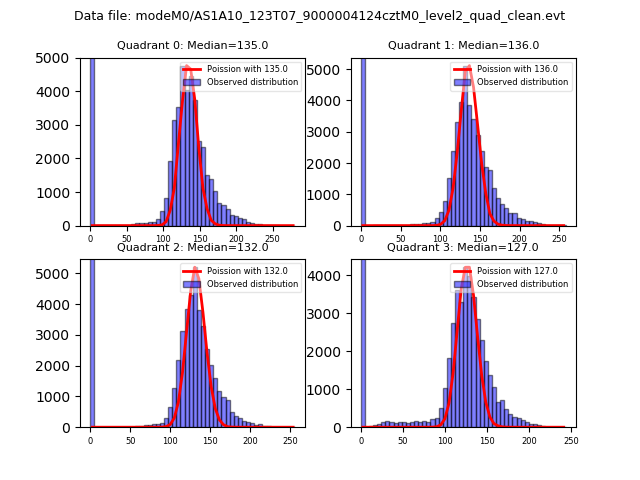 |
 |
| Quadrant-wise count rates Data is divided into 100 sec bins |
 |
|
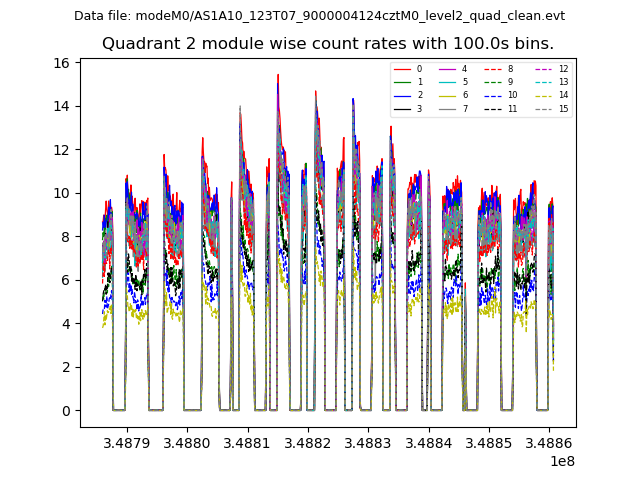
| Module-wise count rates for Quadrant A Data is divided into 100 sec bins |
 |
 |
| Module-wise count rates for Quadrant B Data is divided into 100 sec bins |
 |
 |
| Module-wise count rates for Quadrant C Data is divided into 100 sec bins |
 |
 |
| Module-wise count rates for Quadrant D Data is divided into 100 sec bins |
 |
 |
| Parameter | Plot |
|---|---|
| CZT HV Monitor | 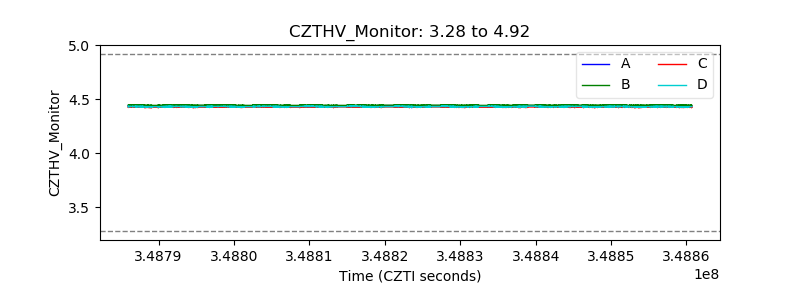 |
| D_VDD | 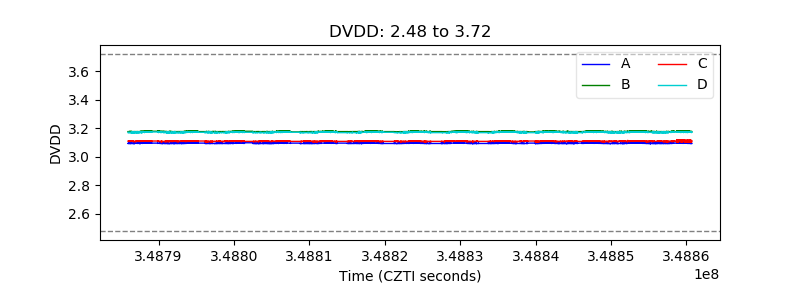 |
| Temperature 1 |  |
| Veto HV Monitor |  |
| Veto LLD | 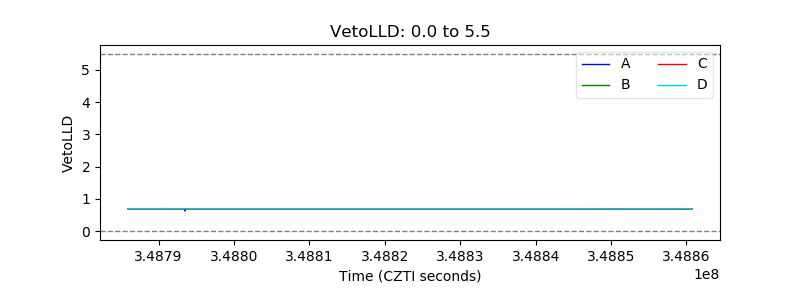 |
| Alpha Counter |  |
| _CPM_Rate | 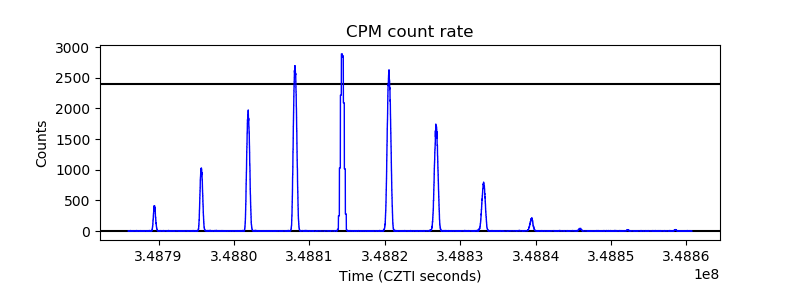 |
| CZT Counter |  |
| +2.5 Volts monitor |  |
| +5 Volts monitor |  |
| _ROLL_ROT |  |
| _Roll_DEC |  |
| _Roll_RA | 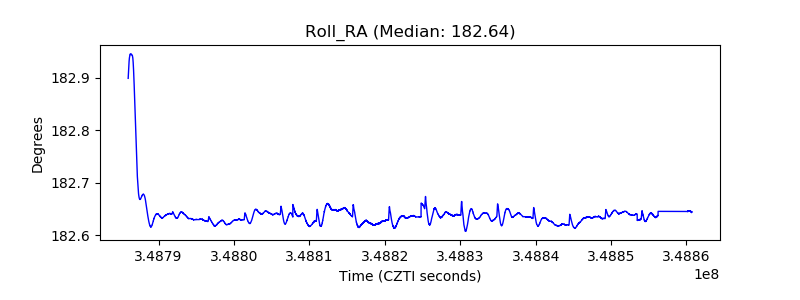 |
| Veto Counter |  |