| Param | Original file | Final file |
|---|---|---|
| Filename | modeM0/AS1A10_123T03_9000004120cztM0_level2_bc.evt | modeM0/AS1A10_123T03_9000004120cztM0_level2_quad_clean.evt |
| Size (bytes) | 2,342,698,560 | 778,420,800 |
| Size | 2.2 GB | 742.4 MB |
| Events in quadrant A | 13,785,435 | 4,955,775 |
| Events in quadrant B | 13,349,901 | 5,019,245 |
| Events in quadrant C | 14,076,454 | 4,805,143 |
| Events in quadrant D | 25,629,860 | 4,663,637 |
| Mode M0 | |||
|---|---|---|---|
| Quadrant | BADHDUFLAG | Total packets | Discarded packets |
| A | 0 | 128949 | 0 |
| B | 0 | 127294 | 0 |
| C | 0 | 131075 | 0 |
| D | 0 | 169852 | 0 |
| Mode SS | |||
|---|---|---|---|
| Quadrant | BADHDUFLAG | Total packets | Discarded packets |
| A | 0 | 1230 | 0 |
| B | 0 | 1230 | 0 |
| C | 0 | 1230 | 0 |
| D | 0 | 1230 | 0 |
| Mode M9 | |||
|---|---|---|---|
| Quadrant | BADHDUFLAG | Total packets | Discarded packets |
| A | 0 | 88 | 0 |
| B | 0 | 88 | 0 |
| C | 0 | 88 | 0 |
| D | 0 | 88 | 0 |
| Quadrant | Total seconds | Saturated seconds | Saturation percentage |
|---|---|---|---|
| A | 60276 | 892 | 1.479859% |
| B | 60276 | 775 | 1.285752% |
| C | 60276 | 1491 | 2.473621% |
| D | 60276 | 3469 | 5.755193% |
Noise dominated data is calculated using 1-second bins in cleaned event files. If a bin has >2000 counts, and if more than 50% of those come from <1% of pixels, then it is considered to be noise-dominated and hence unusable.
| Quadrant | # 1 sec bins | Bins with >0 counts | Bins with >2000 counts | High rate bins dominated by noise | Noise dominated (total time) | Noise dominated (detector-on time) | Marked lightcurve |
|---|---|---|---|---|---|---|---|
| A | 69007 | 60272 | 8 | 8 | 0.01% | 0.01% |  |
| B | 69007 | 60265 | 3 | 3 | 0.00% | 0.00% |  |
| C | 69007 | 60268 | 3 | 3 | 0.00% | 0.00% | 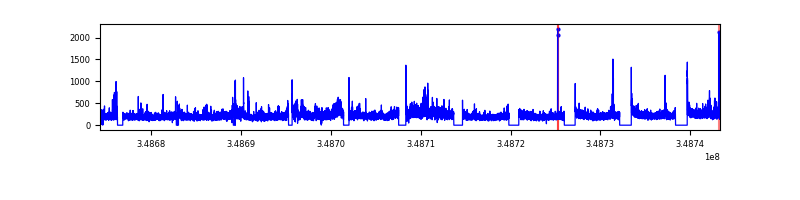 |
| D | 69007 | 60268 | 701 | 701 | 1.02% | 1.16% |  |
Top three noisy pixels from each quadrant. If the there are fewer than three noisy pixels in the level2.evt file, extra rows are filled as -1
| Pixel properties | Quadrant properties | ||||||
|---|---|---|---|---|---|---|---|
| Quadrant | DetID | PixID | Counts | Sigma | Mean | Median | Sigma |
| A | 15 | 174 | 744174 | 1050.4 | 3320 | 3269 | 705.4 |
| A | 14 | 239 | 124507 | 171.88 | 3320 | 3269 | 705.4 |
| A | 13 | 254 | 102053 | 140.05 | 3320 | 3269 | 705.4 |
| B | 4 | 80 | 148511 | 234.1 | 3326 | 3252 | 620.5 |
| B | 0 | 190 | 122237 | 191.75 | 3326 | 3252 | 620.5 |
| B | 10 | 245 | 76482 | 118.02 | 3326 | 3252 | 620.5 |
| C | 3 | 233 | 1680809 | 2259.05 | 3166 | 3158 | 742.6 |
| C | 14 | 254 | 104737 | 136.78 | 3166 | 3158 | 742.6 |
| C | 10 | 22 | 65436 | 83.86 | 3166 | 3158 | 742.6 |
| D | 1 | 52 | 5542278 | 7662.04 | 3187 | 3090 | 722.9 |
| D | 8 | 195 | 3736017 | 5163.54 | 3187 | 3090 | 722.9 |
| D | 7 | 80 | 2089371 | 2885.83 | 3187 | 3090 | 722.9 |
Histogram calculated using DETX and DETY for each event in the final _common_clean file
| Quadrant A |  |
 |
Quadrant B |
|---|---|---|---|
| Quadrant D |  |
 |
Quadrant C |
| Plot type | Count rate plots | Images |
|---|---|---|
| Comparison with Poisson distribution Blue bars denote a histogram of data divided into 1 sec bins. Red curve is a Poisson curve with rate = median count rate of data. |
 |
 |
| Quadrant-wise count rates Data is divided into 100 sec bins |
 |
|
| Module-wise count rates for Quadrant A Data is divided into 100 sec bins |
 |
 |
| Module-wise count rates for Quadrant B Data is divided into 100 sec bins |
 |
 |
| Module-wise count rates for Quadrant C Data is divided into 100 sec bins |
 |
 |
| Module-wise count rates for Quadrant D Data is divided into 100 sec bins |
 |
 |
| Parameter | Plot |
|---|---|
| CZT HV Monitor |  |
| D_VDD |  |
| Temperature 1 |  |
| Veto HV Monitor | 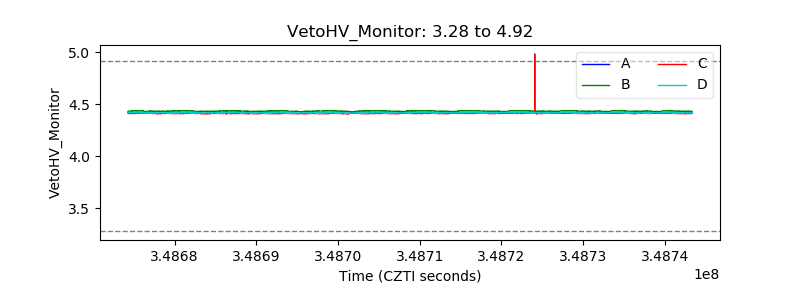 |
| Veto LLD |  |
| Alpha Counter |  |
| _CPM_Rate |  |
| CZT Counter | 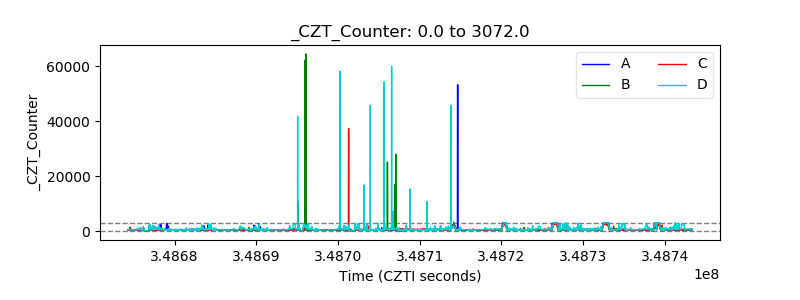 |
| +2.5 Volts monitor | 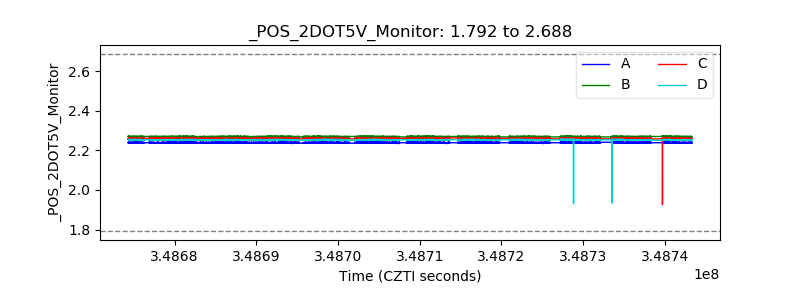 |
| +5 Volts monitor | 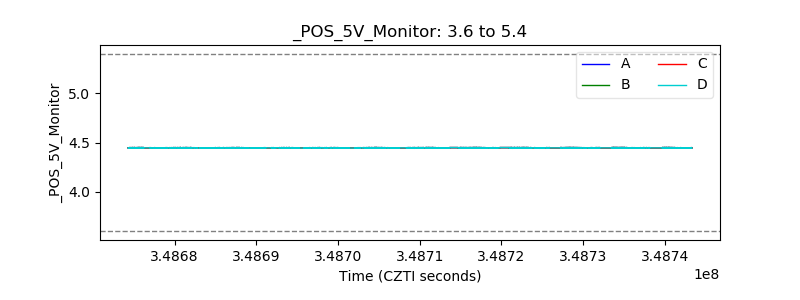 |
| _ROLL_ROT |  |
| _Roll_DEC |  |
| _Roll_RA |  |
| Veto Counter |  |