| Param | Original file | Final file |
|---|---|---|
| Filename | modeM0/AS1A10_021T08_9000004118cztM0_level2_bc.evt | modeM0/AS1A10_021T08_9000004118cztM0_level2_quad_clean.evt |
| Size (bytes) | 1,601,043,840 | 479,289,600 |
| Size | 1.5 GB | 457.1 MB |
| Events in quadrant A | 9,032,970 | 3,034,907 |
| Events in quadrant B | 9,441,863 | 3,089,468 |
| Events in quadrant C | 8,590,768 | 2,959,587 |
| Events in quadrant D | 18,820,310 | 2,812,438 |
| Mode M9 | |||
|---|---|---|---|
| Quadrant | BADHDUFLAG | Total packets | Discarded packets |
| A | 0 | 83 | 0 |
| B | 0 | 83 | 0 |
| C | 0 | 83 | 0 |
| D | 0 | 83 | 0 |
| Mode M0 | |||
|---|---|---|---|
| Quadrant | BADHDUFLAG | Total packets | Discarded packets |
| A | 0 | 81252 | 0 |
| B | 0 | 83441 | 0 |
| C | 0 | 81899 | 0 |
| D | 0 | 118155 | 0 |
| Mode SS | |||
|---|---|---|---|
| Quadrant | BADHDUFLAG | Total packets | Discarded packets |
| A | 0 | 776 | 0 |
| B | 0 | 776 | 0 |
| C | 0 | 776 | 0 |
| D | 0 | 776 | 0 |
| Quadrant | Total seconds | Saturated seconds | Saturation percentage |
|---|---|---|---|
| A | 38159 | 522 | 1.367960% |
| B | 38159 | 692 | 1.813465% |
| C | 38159 | 893 | 2.340208% |
| D | 38159 | 3111 | 8.152729% |
Noise dominated data is calculated using 1-second bins in cleaned event files. If a bin has >2000 counts, and if more than 50% of those come from <1% of pixels, then it is considered to be noise-dominated and hence unusable.
| Quadrant | # 1 sec bins | Bins with >0 counts | Bins with >2000 counts | High rate bins dominated by noise | Noise dominated (total time) | Noise dominated (detector-on time) | Marked lightcurve |
|---|---|---|---|---|---|---|---|
| A | 46429 | 38153 | 5 | 5 | 0.01% | 0.01% |  |
| B | 46429 | 38153 | 21 | 21 | 0.05% | 0.06% |  |
| C | 46429 | 38155 | 0 | 0 | 0.00% | 0.00% |  |
| D | 46429 | 38153 | 1129 | 1129 | 2.43% | 2.96% | 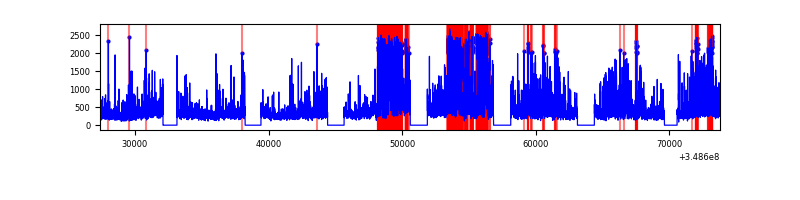 |
Top three noisy pixels from each quadrant. If the there are fewer than three noisy pixels in the level2.evt file, extra rows are filled as -1
| Pixel properties | Quadrant properties | ||||||
|---|---|---|---|---|---|---|---|
| Quadrant | DetID | PixID | Counts | Sigma | Mean | Median | Sigma |
| A | 14 | 254 | 167591 | 349.82 | 2250 | 2214 | 472.7 |
| A | 4 | 2 | 86561 | 178.42 | 2250 | 2214 | 472.7 |
| A | 13 | 254 | 66937 | 136.91 | 2250 | 2214 | 472.7 |
| B | 4 | 80 | 276442 | 667.67 | 2249 | 2203 | 410.7 |
| B | 10 | 245 | 237040 | 571.74 | 2249 | 2203 | 410.7 |
| B | 15 | 33 | 132530 | 317.3 | 2249 | 2203 | 410.7 |
| C | 3 | 233 | 118198 | 231.27 | 2163 | 2159 | 501.7 |
| C | 10 | 22 | 99770 | 194.54 | 2163 | 2159 | 501.7 |
| C | 14 | 254 | 56482 | 108.27 | 2163 | 2159 | 501.7 |
| D | 1 | 52 | 7034690 | 14938.58 | 2128 | 2072 | 470.8 |
| D | 8 | 195 | 1926932 | 4088.76 | 2128 | 2072 | 470.8 |
| D | 7 | 80 | 723864 | 1533.22 | 2128 | 2072 | 470.8 |
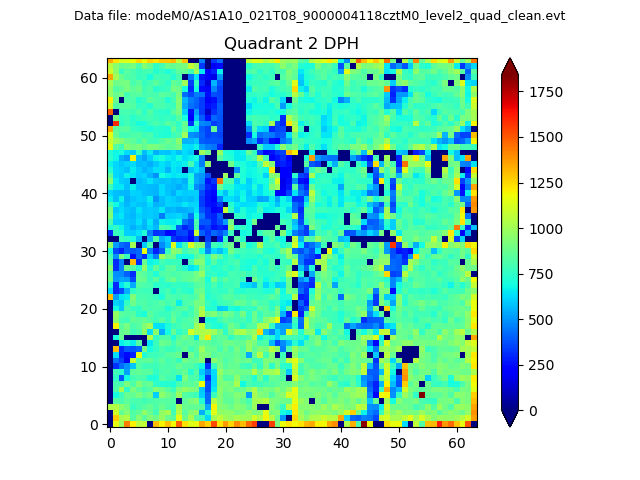
Histogram calculated using DETX and DETY for each event in the final _common_clean file
| Quadrant A |  |
 |
Quadrant B |
|---|---|---|---|
| Quadrant D |  |
 |
Quadrant C |
| Plot type | Count rate plots | Images |
|---|---|---|
| Comparison with Poisson distribution Blue bars denote a histogram of data divided into 1 sec bins. Red curve is a Poisson curve with rate = median count rate of data. |
 |
 |
| Quadrant-wise count rates Data is divided into 100 sec bins |
 |
|
| Module-wise count rates for Quadrant A Data is divided into 100 sec bins |
 |
 |
| Module-wise count rates for Quadrant B Data is divided into 100 sec bins |
 |
 |
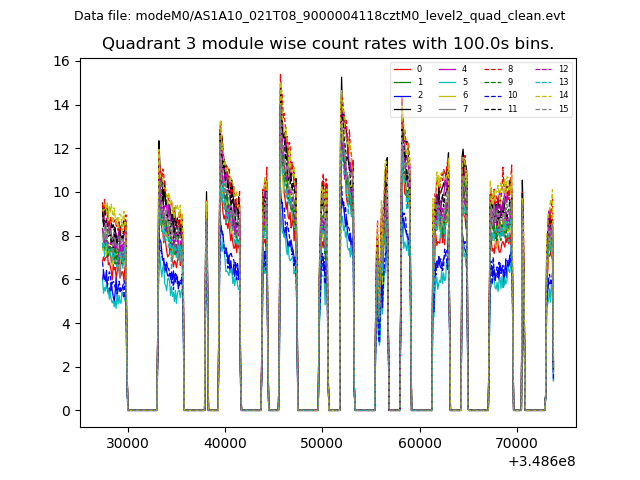
| Module-wise count rates for Quadrant C Data is divided into 100 sec bins |
 |
 |
| Module-wise count rates for Quadrant D Data is divided into 100 sec bins |
 |
 |
| Parameter | Plot |
|---|---|
| CZT HV Monitor |  |
| D_VDD |  |
| Temperature 1 |  |
| Veto HV Monitor |  |
| Veto LLD | 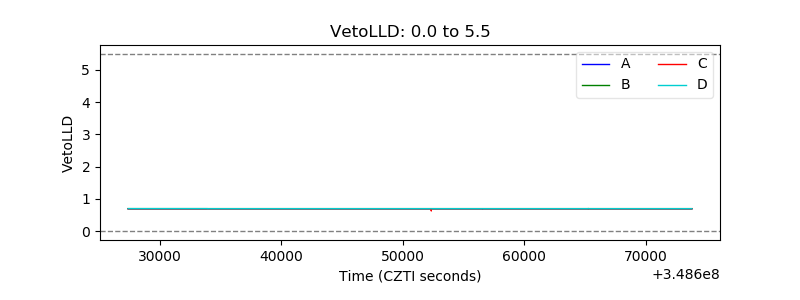 |
| Alpha Counter | 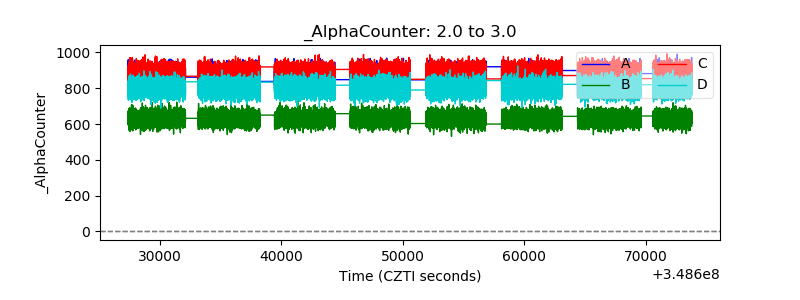 |
| _CPM_Rate |  |
| CZT Counter |  |
| +2.5 Volts monitor | 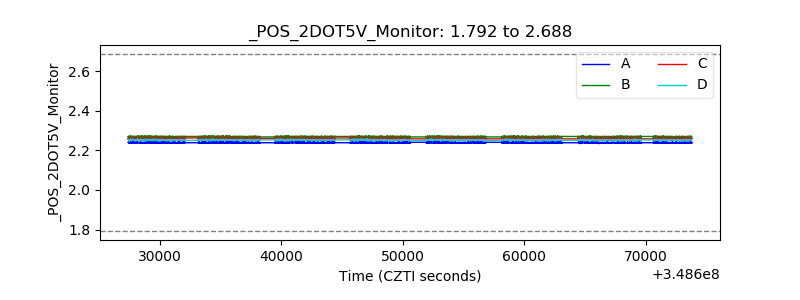 |
| +5 Volts monitor | 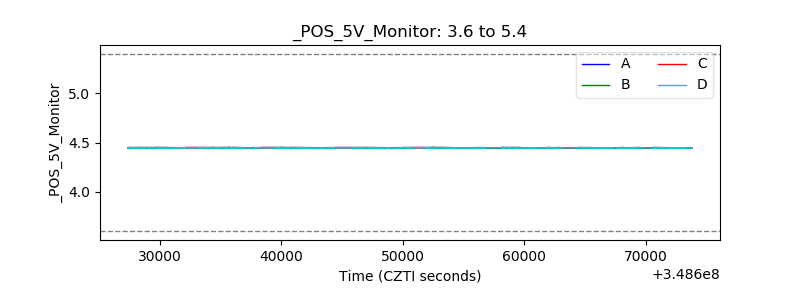 |
| _ROLL_ROT |  |
| _Roll_DEC |  |
| _Roll_RA |  |
| Veto Counter |  |