| Param | Original file | Final file |
|---|---|---|
| Filename | modeM0/AS1A10_021T04_9000004116cztM0_level2_bc.evt | modeM0/AS1A10_021T04_9000004116cztM0_level2_quad_clean.evt |
| Size (bytes) | 3,866,719,680 | 1,073,617,920 |
| Size | 3.6 GB | 1023.9 MB |
| Events in quadrant A | 18,519,618 | 6,805,487 |
| Events in quadrant B | 23,364,146 | 6,897,564 |
| Events in quadrant C | 22,271,106 | 6,632,165 |
| Events in quadrant D | 47,143,411 | 6,333,592 |
| Mode M0 | |||
|---|---|---|---|
| Quadrant | BADHDUFLAG | Total packets | Discarded packets |
| A | 0 | 178760 | 0 |
| B | 0 | 196524 | 0 |
| C | 0 | 196915 | 0 |
| D | 0 | 279035 | 0 |
| Mode SS | |||
|---|---|---|---|
| Quadrant | BADHDUFLAG | Total packets | Discarded packets |
| A | 0 | 1742 | 0 |
| B | 0 | 1742 | 0 |
| C | 0 | 1742 | 0 |
| D | 0 | 1742 | 0 |
| Mode M9 | |||
|---|---|---|---|
| Quadrant | BADHDUFLAG | Total packets | Discarded packets |
| A | 0 | 133 | 0 |
| B | 0 | 133 | 0 |
| C | 0 | 133 | 0 |
| D | 0 | 133 | 0 |
| Quadrant | Total seconds | Saturated seconds | Saturation percentage |
|---|---|---|---|
| A | 85321 | 903 | 1.058356% |
| B | 85321 | 2262 | 2.651164% |
| C | 85321 | 2391 | 2.802358% |
| D | 85321 | 8248 | 9.667022% |
Noise dominated data is calculated using 1-second bins in cleaned event files. If a bin has >2000 counts, and if more than 50% of those come from <1% of pixels, then it is considered to be noise-dominated and hence unusable.
| Quadrant | # 1 sec bins | Bins with >0 counts | Bins with >2000 counts | High rate bins dominated by noise | Noise dominated (total time) | Noise dominated (detector-on time) | Marked lightcurve |
|---|---|---|---|---|---|---|---|
| A | 98766 | 85310 | 0 | 0 | 0.00% | 0.00% |  |
| B | 98766 | 85306 | 99 | 99 | 0.10% | 0.12% |  |
| C | 98766 | 85306 | 10 | 10 | 0.01% | 0.01% |  |
| D | 98766 | 85309 | 1842 | 1842 | 1.87% | 2.16% |  |
Top three noisy pixels from each quadrant. If the there are fewer than three noisy pixels in the level2.evt file, extra rows are filled as -1
| Pixel properties | Quadrant properties | ||||||
|---|---|---|---|---|---|---|---|
| Quadrant | DetID | PixID | Counts | Sigma | Mean | Median | Sigma |
| A | 15 | 174 | 261073 | 254.78 | 4696 | 4615 | 1006.6 |
| A | 13 | 254 | 144264 | 138.73 | 4696 | 4615 | 1006.6 |
| A | 6 | 16 | 45186 | 40.3 | 4696 | 4615 | 1006.6 |
| B | 10 | 245 | 4545226 | 5222.19 | 4684 | 4585 | 869.5 |
| B | 15 | 33 | 355159 | 403.2 | 4684 | 4585 | 869.5 |
| B | 10 | 247 | 191307 | 214.75 | 4684 | 4585 | 869.5 |
| C | 3 | 233 | 3979094 | 3760.1 | 4502 | 4487 | 1057.0 |
| C | 2 | 16 | 840602 | 790.99 | 4502 | 4487 | 1057.0 |
| C | 14 | 254 | 168402 | 155.07 | 4502 | 4487 | 1057.0 |
| D | 1 | 52 | 15907939 | 15767.72 | 4436 | 4301 | 1008.6 |
| D | 8 | 195 | 9110409 | 9028.28 | 4436 | 4301 | 1008.6 |
| D | 7 | 80 | 3327831 | 3295.13 | 4436 | 4301 | 1008.6 |
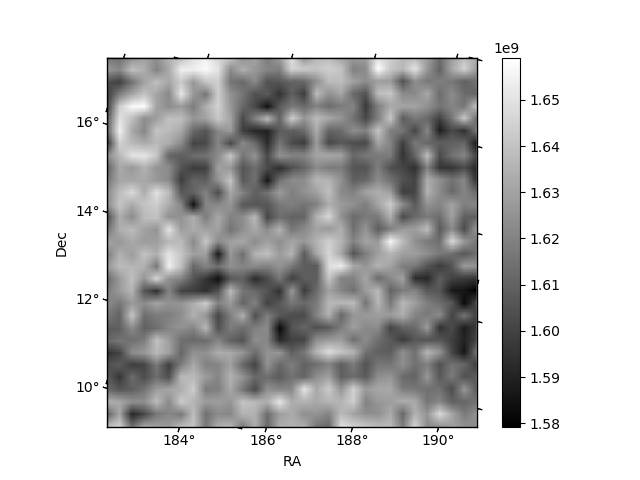
Histogram calculated using DETX and DETY for each event in the final _common_clean file
| Quadrant A |  |
 |
Quadrant B |
|---|---|---|---|
| Quadrant D |  |
 |
Quadrant C |
| Plot type | Count rate plots | Images |
|---|---|---|
| Comparison with Poisson distribution Blue bars denote a histogram of data divided into 1 sec bins. Red curve is a Poisson curve with rate = median count rate of data. |
 |
 |
| Quadrant-wise count rates Data is divided into 100 sec bins |
 |
|
| Module-wise count rates for Quadrant A Data is divided into 100 sec bins |
 |
 |
| Module-wise count rates for Quadrant B Data is divided into 100 sec bins |
 |
 |
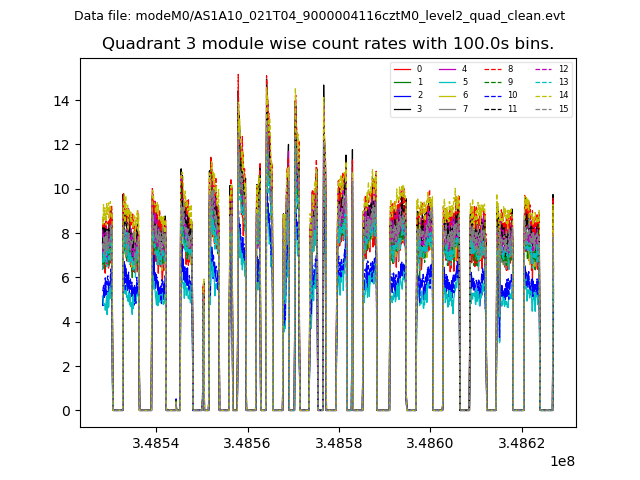
| Module-wise count rates for Quadrant C Data is divided into 100 sec bins |
 |
 |
| Module-wise count rates for Quadrant D Data is divided into 100 sec bins |
 |
 |
| Parameter | Plot |
|---|---|
| CZT HV Monitor |  |
| D_VDD |  |
| Temperature 1 | 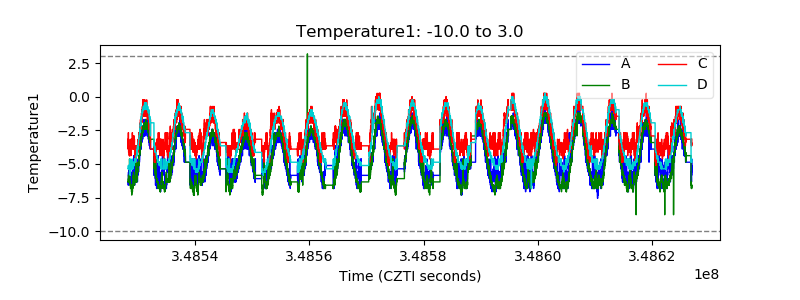 |
| Veto HV Monitor |  |
| Veto LLD |  |
| Alpha Counter |  |
| _CPM_Rate |  |
| CZT Counter |  |
| +2.5 Volts monitor |  |
| +5 Volts monitor |  |
| _ROLL_ROT | 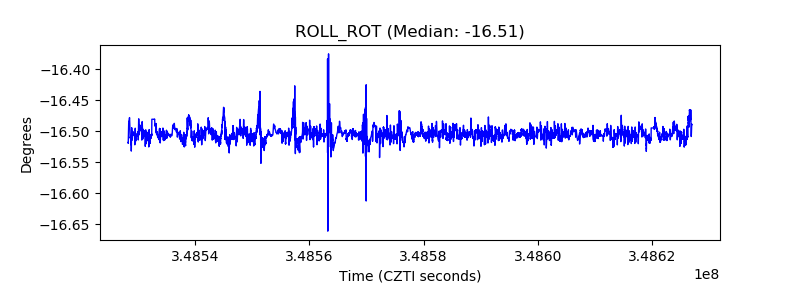 |
| _Roll_DEC |  |
| _Roll_RA |  |
| Veto Counter |  |