| Param | Original file | Final file |
|---|---|---|
| Filename | modeM0/AS1A10_110T03_9000004114cztM0_level2_bc.evt | modeM0/AS1A10_110T03_9000004114cztM0_level2_quad_clean.evt |
| Size (bytes) | 3,417,606,720 | 928,854,720 |
| Size | 3.2 GB | 885.8 MB |
| Events in quadrant A | 16,228,051 | 5,906,167 |
| Events in quadrant B | 19,931,737 | 5,971,830 |
| Events in quadrant C | 17,147,181 | 5,730,262 |
| Events in quadrant D | 45,126,773 | 5,417,493 |
| Mode M9 | |||
|---|---|---|---|
| Quadrant | BADHDUFLAG | Total packets | Discarded packets |
| A | 0 | 119 | 0 |
| B | 0 | 119 | 0 |
| C | 0 | 119 | 0 |
| D | 0 | 119 | 0 |
| Mode M0 | |||
|---|---|---|---|
| Quadrant | BADHDUFLAG | Total packets | Discarded packets |
| A | 0 | 156231 | 0 |
| B | 0 | 172291 | 0 |
| C | 0 | 163043 | 0 |
| D | 0 | 261755 | 0 |
| Mode SS | |||
|---|---|---|---|
| Quadrant | BADHDUFLAG | Total packets | Discarded packets |
| A | 0 | 1516 | 0 |
| B | 0 | 1516 | 0 |
| C | 0 | 1516 | 0 |
| D | 0 | 1516 | 0 |
| Quadrant | Total seconds | Saturated seconds | Saturation percentage |
|---|---|---|---|
| A | 74493 | 860 | 1.154471% |
| B | 74493 | 2146 | 2.880808% |
| C | 74493 | 2270 | 3.047266% |
| D | 74493 | 7705 | 10.343254% |
Noise dominated data is calculated using 1-second bins in cleaned event files. If a bin has >2000 counts, and if more than 50% of those come from <1% of pixels, then it is considered to be noise-dominated and hence unusable.
| Quadrant | # 1 sec bins | Bins with >0 counts | Bins with >2000 counts | High rate bins dominated by noise | Noise dominated (total time) | Noise dominated (detector-on time) | Marked lightcurve |
|---|---|---|---|---|---|---|---|
| A | 86258 | 74487 | 0 | 0 | 0.00% | 0.00% |  |
| B | 86258 | 74478 | 42 | 42 | 0.05% | 0.06% | 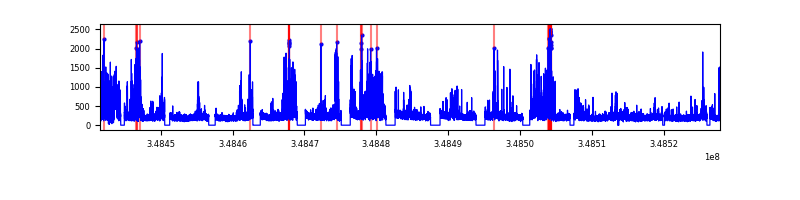 |
| C | 86258 | 74484 | 8 | 8 | 0.01% | 0.01% |  |
| D | 86258 | 74483 | 1320 | 1320 | 1.53% | 1.77% |  |
Top three noisy pixels from each quadrant. If the there are fewer than three noisy pixels in the level2.evt file, extra rows are filled as -1
| Pixel properties | Quadrant properties | ||||||
|---|---|---|---|---|---|---|---|
| Quadrant | DetID | PixID | Counts | Sigma | Mean | Median | Sigma |
| A | 13 | 254 | 124297 | 135.92 | 4172 | 4108 | 884.3 |
| A | 15 | 174 | 92931 | 100.45 | 4172 | 4108 | 884.3 |
| A | 0 | 226 | 26526 | 25.35 | 4172 | 4108 | 884.3 |
| B | 10 | 245 | 2916621 | 3765.11 | 4160 | 4063 | 773.6 |
| B | 15 | 33 | 771649 | 992.27 | 4160 | 4063 | 773.6 |
| B | 0 | 190 | 101969 | 126.56 | 4160 | 4063 | 773.6 |
| C | 3 | 233 | 1403874 | 1501.51 | 3995 | 3987 | 932.3 |
| C | 14 | 254 | 178849 | 187.56 | 3995 | 3987 | 932.3 |
| C | 2 | 16 | 88286 | 90.42 | 3995 | 3987 | 932.3 |
| D | 1 | 52 | 18083806 | 20123.33 | 3946 | 3823 | 898.5 |
| D | 8 | 195 | 6481600 | 7209.88 | 3946 | 3823 | 898.5 |
| D | 7 | 80 | 4187668 | 4656.69 | 3946 | 3823 | 898.5 |
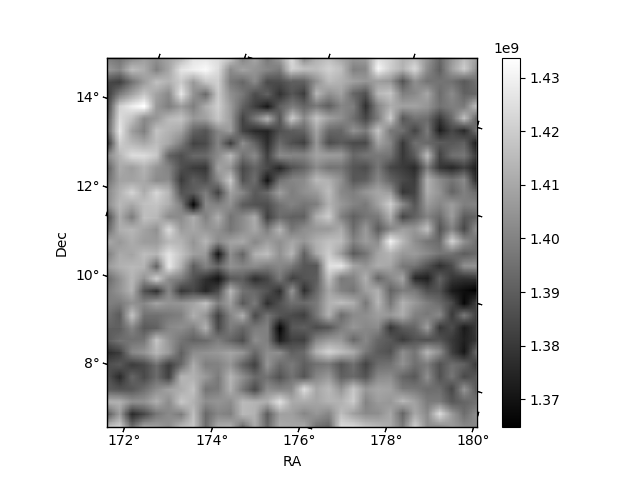
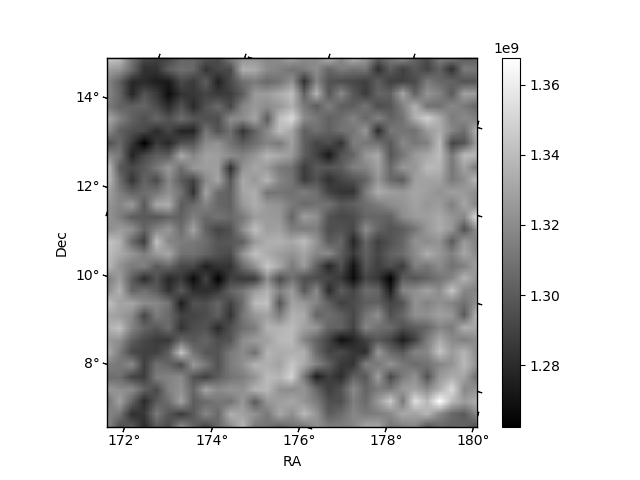
Histogram calculated using DETX and DETY for each event in the final _common_clean file
| Quadrant A |  |
 |
Quadrant B |
|---|---|---|---|
| Quadrant D |  |
 |
Quadrant C |
| Plot type | Count rate plots | Images |
|---|---|---|
| Comparison with Poisson distribution Blue bars denote a histogram of data divided into 1 sec bins. Red curve is a Poisson curve with rate = median count rate of data. |
 |
 |
| Quadrant-wise count rates Data is divided into 100 sec bins |
 |
|
| Module-wise count rates for Quadrant A Data is divided into 100 sec bins |
 |
 |
| Module-wise count rates for Quadrant B Data is divided into 100 sec bins |
 |
 |
| Module-wise count rates for Quadrant C Data is divided into 100 sec bins |
 |
 |
| Module-wise count rates for Quadrant D Data is divided into 100 sec bins |
 |
 |
| Parameter | Plot |
|---|---|
| CZT HV Monitor |  |
| D_VDD |  |
| Temperature 1 |  |
| Veto HV Monitor | 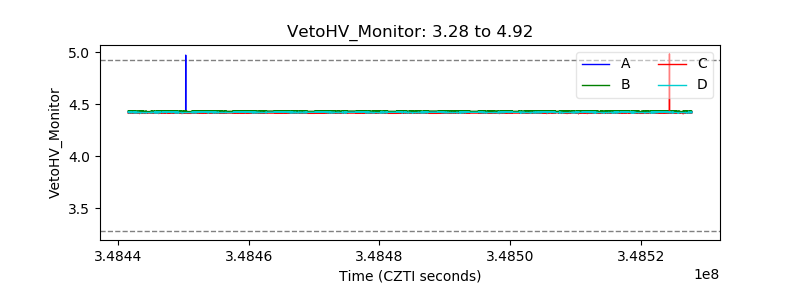 |
| Veto LLD | 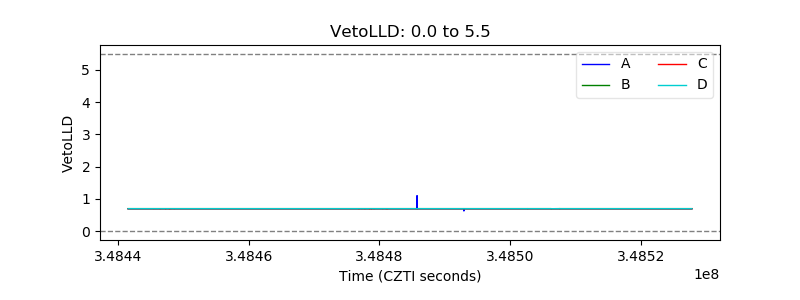 |
| Alpha Counter |  |
| _CPM_Rate |  |
| CZT Counter |  |
| +2.5 Volts monitor |  |
| +5 Volts monitor |  |
| _ROLL_ROT |  |
| _Roll_DEC |  |
| _Roll_RA |  |
| Veto Counter |  |