| Param | Original file | Final file |
|---|---|---|
| Filename | modeM0/AS1A10_073T08_9000004112cztM0_level2_bc.evt | modeM0/AS1A10_073T08_9000004112cztM0_level2_quad_clean.evt |
| Size (bytes) | 4,238,323,200 | 1,304,020,800 |
| Size | 3.9 GB | 1.2 GB |
| Events in quadrant A | 24,051,651 | 8,555,724 |
| Events in quadrant B | 30,689,823 | 8,526,679 |
| Events in quadrant C | 20,718,670 | 8,154,355 |
| Events in quadrant D | 46,360,490 | 7,675,012 |
| Mode M0 | |||
|---|---|---|---|
| Quadrant | BADHDUFLAG | Total packets | Discarded packets |
| A | 0 | 213200 | 0 |
| B | 0 | 237488 | 0 |
| C | 0 | 207161 | 0 |
| D | 0 | 293683 | 0 |
| Mode SS | |||
|---|---|---|---|
| Quadrant | BADHDUFLAG | Total packets | Discarded packets |
| A | 0 | 1954 | 0 |
| B | 0 | 1954 | 0 |
| C | 0 | 1954 | 0 |
| D | 0 | 1954 | 0 |
| Mode M9 | |||
|---|---|---|---|
| Quadrant | BADHDUFLAG | Total packets | Discarded packets |
| A | 0 | 135 | 0 |
| B | 0 | 135 | 0 |
| C | 0 | 135 | 0 |
| D | 0 | 135 | 0 |
| Quadrant | Total seconds | Saturated seconds | Saturation percentage |
|---|---|---|---|
| A | 96074 | 2186 | 2.275329% |
| B | 96073 | 4522 | 4.706838% |
| C | 96074 | 3723 | 3.875138% |
| D | 96074 | 6611 | 6.881154% |
Noise dominated data is calculated using 1-second bins in cleaned event files. If a bin has >2000 counts, and if more than 50% of those come from <1% of pixels, then it is considered to be noise-dominated and hence unusable.
| Quadrant | # 1 sec bins | Bins with >0 counts | Bins with >2000 counts | High rate bins dominated by noise | Noise dominated (total time) | Noise dominated (detector-on time) | Marked lightcurve |
|---|---|---|---|---|---|---|---|
| A | 109410 | 96079 | 97 | 97 | 0.09% | 0.10% |  |
| B | 109410 | 96075 | 219 | 219 | 0.20% | 0.23% |  |
| C | 109410 | 96064 | 86 | 86 | 0.08% | 0.09% | 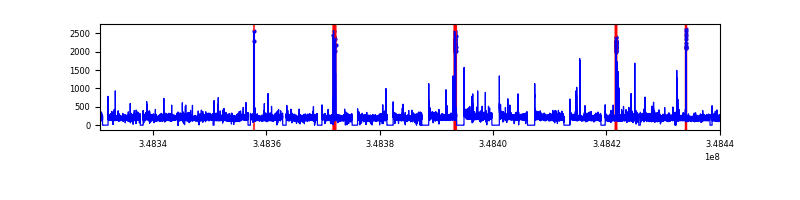 |
| D | 109410 | 96079 | 1280 | 1280 | 1.17% | 1.33% |  |
Top three noisy pixels from each quadrant. If the there are fewer than three noisy pixels in the level2.evt file, extra rows are filled as -1
| Pixel properties | Quadrant properties | ||||||
|---|---|---|---|---|---|---|---|
| Quadrant | DetID | PixID | Counts | Sigma | Mean | Median | Sigma |
| A | 15 | 174 | 2923275 | 2495.38 | 5402 | 5299 | 1169.4 |
| A | 13 | 254 | 173153 | 143.54 | 5402 | 5299 | 1169.4 |
| A | 12 | 16 | 111432 | 90.76 | 5402 | 5299 | 1169.4 |
| B | 10 | 245 | 9410864 | 9369.03 | 5370 | 5251 | 1003.9 |
| B | 5 | 172 | 130458 | 124.72 | 5370 | 5251 | 1003.9 |
| B | 3 | 209 | 116249 | 110.57 | 5370 | 5251 | 1003.9 |
| C | 2 | 16 | 515806 | 422.43 | 5107 | 5087 | 1209.0 |
| C | 14 | 254 | 329056 | 267.96 | 5107 | 5087 | 1209.0 |
| C | 14 | 128 | 119214 | 94.4 | 5107 | 5087 | 1209.0 |
| D | 1 | 52 | 17164932 | 14560.25 | 5113 | 4941 | 1178.6 |
| D | 8 | 195 | 7063274 | 5988.99 | 5113 | 4941 | 1178.6 |
| D | 2 | 250 | 617568 | 519.81 | 5113 | 4941 | 1178.6 |
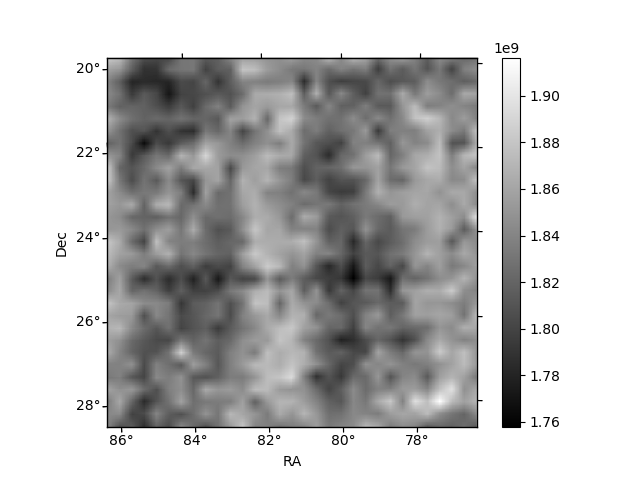
Histogram calculated using DETX and DETY for each event in the final _common_clean file
| Quadrant A |  |
 |
Quadrant B |
|---|---|---|---|
| Quadrant D |  |
 |
Quadrant C |
| Plot type | Count rate plots | Images |
|---|---|---|
| Comparison with Poisson distribution Blue bars denote a histogram of data divided into 1 sec bins. Red curve is a Poisson curve with rate = median count rate of data. |
 |
 |
| Quadrant-wise count rates Data is divided into 100 sec bins |
 |
|
| Module-wise count rates for Quadrant A Data is divided into 100 sec bins |
 |
 |
| Module-wise count rates for Quadrant B Data is divided into 100 sec bins |
 |
 |
| Module-wise count rates for Quadrant C Data is divided into 100 sec bins |
 |
 |
| Module-wise count rates for Quadrant D Data is divided into 100 sec bins |
 |
 |
| Parameter | Plot |
|---|---|
| CZT HV Monitor |  |
| D_VDD |  |
| Temperature 1 |  |
| Veto HV Monitor |  |
| Veto LLD |  |
| Alpha Counter |  |
| _CPM_Rate | 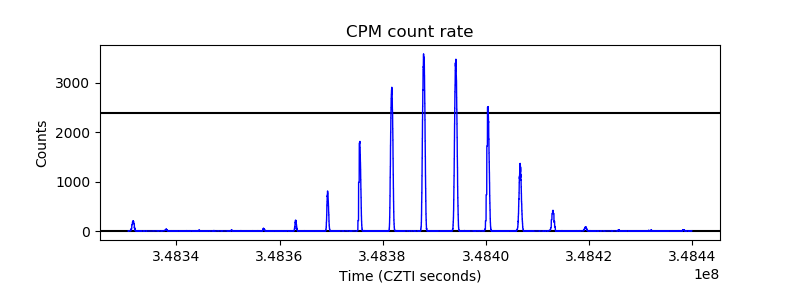 |
| CZT Counter |  |
| +2.5 Volts monitor |  |
| +5 Volts monitor |  |
| _ROLL_ROT |  |
| _Roll_DEC |  |
| _Roll_RA |  |
| Veto Counter |  |