| Param | Original file | Final file |
|---|---|---|
| Filename | modeM0/AS1A10_045T07_9000004110cztM0_level2_bc.evt | modeM0/AS1A10_045T07_9000004110cztM0_level2_quad_clean.evt |
| Size (bytes) | 3,500,760,960 | 993,712,320 |
| Size | 3.3 GB | 947.7 MB |
| Events in quadrant A | 18,135,309 | 6,305,523 |
| Events in quadrant B | 21,038,808 | 6,360,106 |
| Events in quadrant C | 16,784,990 | 6,207,226 |
| Events in quadrant D | 44,646,265 | 5,770,406 |
| Mode SS | |||
|---|---|---|---|
| Quadrant | BADHDUFLAG | Total packets | Discarded packets |
| A | 0 | 1568 | 0 |
| B | 0 | 1568 | 0 |
| C | 0 | 1568 | 0 |
| D | 0 | 1568 | 0 |
| Mode M9 | |||
|---|---|---|---|
| Quadrant | BADHDUFLAG | Total packets | Discarded packets |
| A | 0 | 135 | 0 |
| B | 0 | 135 | 0 |
| C | 0 | 135 | 0 |
| D | 0 | 135 | 0 |
| Mode M0 | |||
|---|---|---|---|
| Quadrant | BADHDUFLAG | Total packets | Discarded packets |
| A | 0 | 169618 | 0 |
| B | 0 | 181286 | 0 |
| C | 0 | 168151 | 0 |
| D | 0 | 269962 | 0 |
| Quadrant | Total seconds | Saturated seconds | Saturation percentage |
|---|---|---|---|
| A | 79738 | 1141 | 1.430936% |
| B | 79738 | 2241 | 2.810454% |
| C | 79738 | 1784 | 2.237327% |
| D | 79738 | 8457 | 10.605985% |
Noise dominated data is calculated using 1-second bins in cleaned event files. If a bin has >2000 counts, and if more than 50% of those come from <1% of pixels, then it is considered to be noise-dominated and hence unusable.
| Quadrant | # 1 sec bins | Bins with >0 counts | Bins with >2000 counts | High rate bins dominated by noise | Noise dominated (total time) | Noise dominated (detector-on time) | Marked lightcurve |
|---|---|---|---|---|---|---|---|
| A | 93083 | 79743 | 16 | 16 | 0.02% | 0.02% |  |
| B | 93082 | 79738 | 50 | 50 | 0.05% | 0.06% |  |
| C | 93083 | 79741 | 0 | 0 | 0.00% | 0.00% |  |
| D | 93083 | 79740 | 1675 | 1675 | 1.80% | 2.10% | 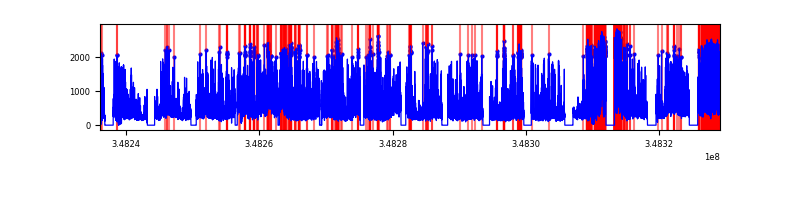 |
Top three noisy pixels from each quadrant. If the there are fewer than three noisy pixels in the level2.evt file, extra rows are filled as -1
| Pixel properties | Quadrant properties | ||||||
|---|---|---|---|---|---|---|---|
| Quadrant | DetID | PixID | Counts | Sigma | Mean | Median | Sigma |
| A | 15 | 174 | 751635 | 793.37 | 4433 | 4363 | 941.9 |
| A | 13 | 254 | 136031 | 139.79 | 4433 | 4363 | 941.9 |
| A | 15 | 47 | 73884 | 73.81 | 4433 | 4363 | 941.9 |
| B | 10 | 245 | 3362751 | 4138.48 | 4409 | 4312 | 811.5 |
| B | 10 | 246 | 366527 | 446.34 | 4409 | 4312 | 811.5 |
| B | 0 | 230 | 93208 | 109.54 | 4409 | 4312 | 811.5 |
| C | 14 | 254 | 92553 | 88.38 | 4286 | 4281 | 998.7 |
| C | 0 | 10 | 69744 | 65.55 | 4286 | 4281 | 998.7 |
| C | 7 | 247 | 60499 | 56.29 | 4286 | 4281 | 998.7 |
| D | 1 | 52 | 18680969 | 19932.92 | 4148 | 4026 | 937.0 |
| D | 8 | 195 | 6560281 | 6997.15 | 4148 | 4026 | 937.0 |
| D | 13 | 104 | 1383779 | 1472.54 | 4148 | 4026 | 937.0 |
Histogram calculated using DETX and DETY for each event in the final _common_clean file
| Quadrant A |  |
 |
Quadrant B |
|---|---|---|---|
| Quadrant D |  |
 |
Quadrant C |
| Plot type | Count rate plots | Images |
|---|---|---|
| Comparison with Poisson distribution Blue bars denote a histogram of data divided into 1 sec bins. Red curve is a Poisson curve with rate = median count rate of data. |
 |
 |
| Quadrant-wise count rates Data is divided into 100 sec bins |
 |
|
| Module-wise count rates for Quadrant A Data is divided into 100 sec bins |
 |
 |
| Module-wise count rates for Quadrant B Data is divided into 100 sec bins |
 |
 |
| Module-wise count rates for Quadrant C Data is divided into 100 sec bins |
 |
 |
| Module-wise count rates for Quadrant D Data is divided into 100 sec bins |
 |
 |
| Parameter | Plot |
|---|---|
| CZT HV Monitor |  |
| D_VDD | 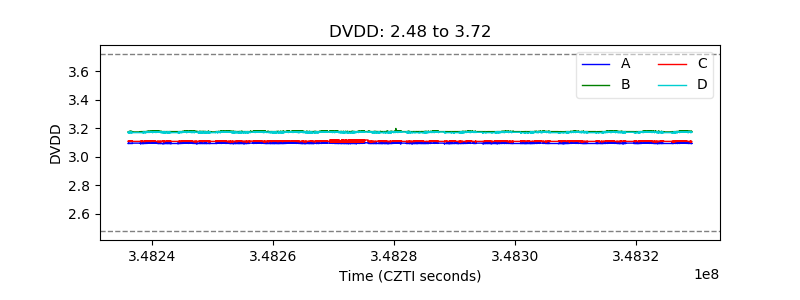 |
| Temperature 1 |  |
| Veto HV Monitor |  |
| Veto LLD |  |
| Alpha Counter |  |
| _CPM_Rate | 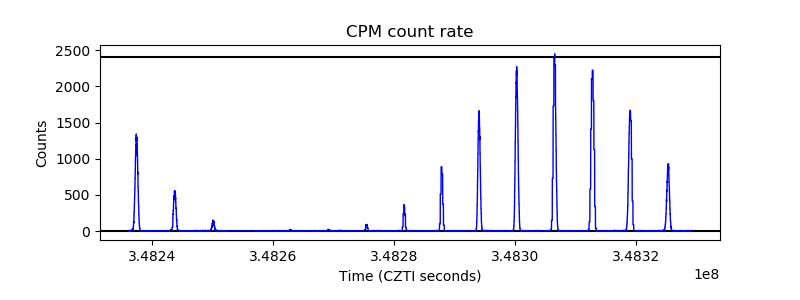 |
| CZT Counter |  |
| +2.5 Volts monitor |  |
| +5 Volts monitor |  |
| _ROLL_ROT |  |
| _Roll_DEC |  |
| _Roll_RA |  |
| Veto Counter | 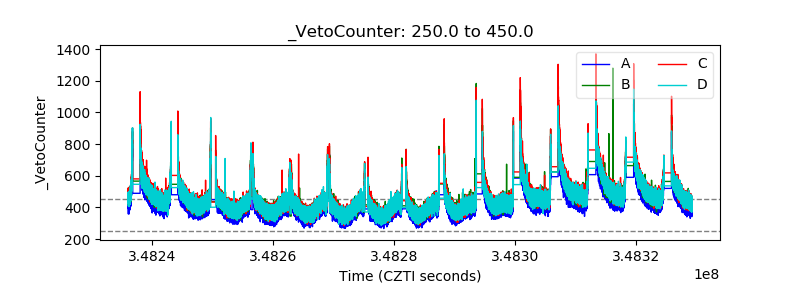 |