| Param | Original file | Final file |
|---|---|---|
| Filename | modeM0/AS1A10_045T06_9000004108cztM0_level2_bc.evt | modeM0/AS1A10_045T06_9000004108cztM0_level2_quad_clean.evt |
| Size (bytes) | 8,252,798,400 | 2,454,217,920 |
| Size | 7.7 GB | 2.3 GB |
| Events in quadrant A | 49,544,645 | 15,461,197 |
| Events in quadrant B | 51,003,097 | 15,566,306 |
| Events in quadrant C | 42,493,230 | 15,211,004 |
| Events in quadrant D | 93,560,469 | 14,663,715 |
| Mode M9 | |||
|---|---|---|---|
| Quadrant | BADHDUFLAG | Total packets | Discarded packets |
| A | 0 | 309 | 0 |
| B | 0 | 309 | 0 |
| C | 0 | 309 | 0 |
| D | 0 | 309 | 0 |
| Mode M0 | |||
|---|---|---|---|
| Quadrant | BADHDUFLAG | Total packets | Discarded packets |
| A | 0 | 433557 | 0 |
| B | 0 | 442854 | 0 |
| C | 0 | 417618 | 0 |
| D | 0 | 591198 | 0 |
| Mode SS | |||
|---|---|---|---|
| Quadrant | BADHDUFLAG | Total packets | Discarded packets |
| A | 0 | 3998 | 0 |
| B | 0 | 3998 | 0 |
| C | 0 | 3998 | 0 |
| D | 0 | 3998 | 0 |
| Quadrant | Total seconds | Saturated seconds | Saturation percentage |
|---|---|---|---|
| A | 196128 | 2804 | 1.429679% |
| B | 196129 | 4468 | 2.278092% |
| C | 196129 | 4201 | 2.141958% |
| D | 196128 | 9786 | 4.989599% |
Noise dominated data is calculated using 1-second bins in cleaned event files. If a bin has >2000 counts, and if more than 50% of those come from <1% of pixels, then it is considered to be noise-dominated and hence unusable.
| Quadrant | # 1 sec bins | Bins with >0 counts | Bins with >2000 counts | High rate bins dominated by noise | Noise dominated (total time) | Noise dominated (detector-on time) | Marked lightcurve |
|---|---|---|---|---|---|---|---|
| A | 227225 | 196109 | 63 | 63 | 0.03% | 0.03% |  |
| B | 227225 | 196098 | 165 | 165 | 0.07% | 0.08% |  |
| C | 227225 | 196102 | 6 | 6 | 0.00% | 0.00% |  |
| D | 227225 | 196106 | 1162 | 1162 | 0.51% | 0.59% |  |
Top three noisy pixels from each quadrant. If the there are fewer than three noisy pixels in the level2.evt file, extra rows are filled as -1
| Pixel properties | Quadrant properties | ||||||
|---|---|---|---|---|---|---|---|
| Quadrant | DetID | PixID | Counts | Sigma | Mean | Median | Sigma |
| A | 15 | 47 | 4936523 | 2160.92 | 10801 | 10633 | 2279.5 |
| A | 15 | 174 | 1683407 | 733.82 | 10801 | 10633 | 2279.5 |
| A | 12 | 16 | 774635 | 335.16 | 10801 | 10633 | 2279.5 |
| B | 10 | 245 | 7550989 | 3754.9 | 10796 | 10548 | 2008.2 |
| B | 10 | 246 | 386874 | 187.4 | 10796 | 10548 | 2008.2 |
| B | 4 | 80 | 359259 | 173.65 | 10796 | 10548 | 2008.2 |
| C | 7 | 247 | 895609 | 363.68 | 10456 | 10433 | 2434.0 |
| C | 3 | 233 | 644892 | 260.67 | 10456 | 10433 | 2434.0 |
| C | 15 | 208 | 281067 | 111.19 | 10456 | 10433 | 2434.0 |
| D | 1 | 52 | 30308954 | 12697.64 | 10525 | 10213 | 2386.2 |
| D | 8 | 195 | 18239978 | 7639.75 | 10525 | 10213 | 2386.2 |
| D | 2 | 250 | 2020887 | 842.64 | 10525 | 10213 | 2386.2 |
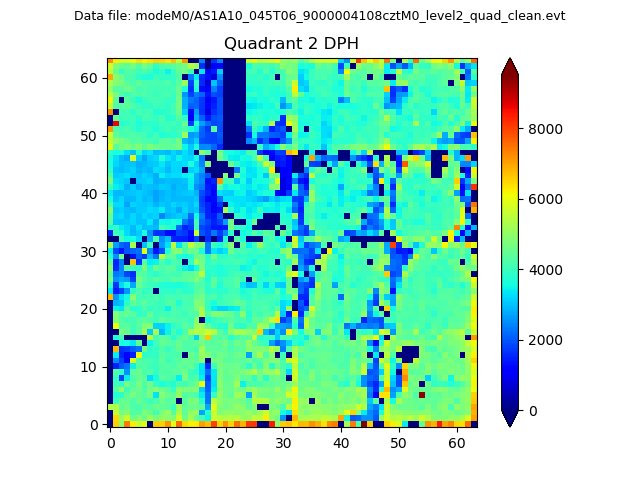
Histogram calculated using DETX and DETY for each event in the final _common_clean file
| Quadrant A |  |
 |
Quadrant B |
|---|---|---|---|
| Quadrant D |  |
 |
Quadrant C |
| Plot type | Count rate plots | Images |
|---|---|---|
| Comparison with Poisson distribution Blue bars denote a histogram of data divided into 1 sec bins. Red curve is a Poisson curve with rate = median count rate of data. |
 |
 |
| Quadrant-wise count rates Data is divided into 100 sec bins |
 |
|
| Module-wise count rates for Quadrant A Data is divided into 100 sec bins |
 |
 |
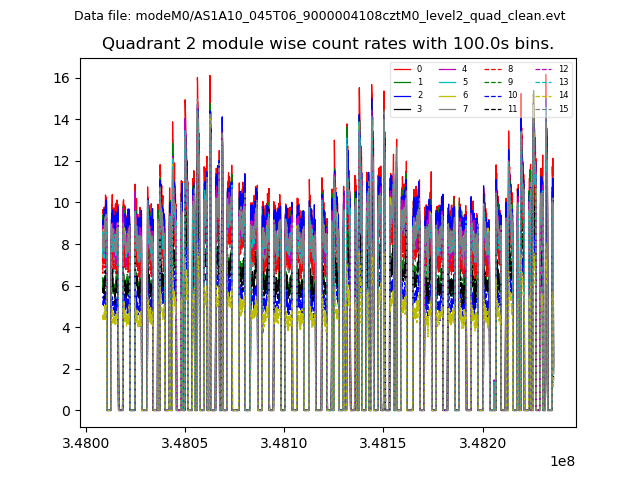
| Module-wise count rates for Quadrant B Data is divided into 100 sec bins |
 |
 |
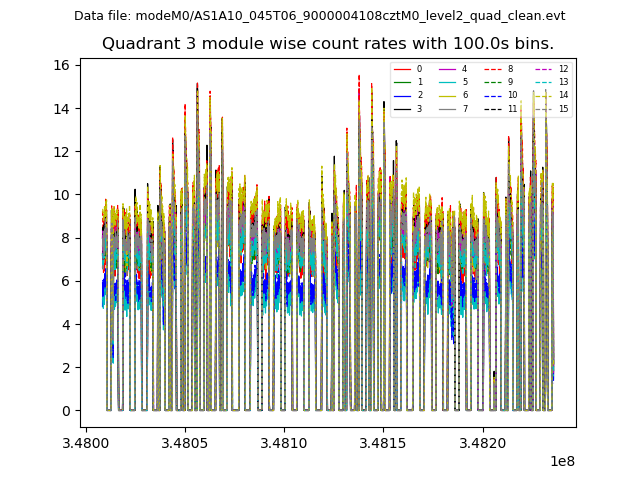
| Module-wise count rates for Quadrant C Data is divided into 100 sec bins |
 |
 |
| Module-wise count rates for Quadrant D Data is divided into 100 sec bins |
 |
 |
| Parameter | Plot |
|---|---|
| CZT HV Monitor |  |
| D_VDD |  |
| Temperature 1 |  |
| Veto HV Monitor |  |
| Veto LLD |  |
| Alpha Counter |  |
| _CPM_Rate |  |
| CZT Counter | 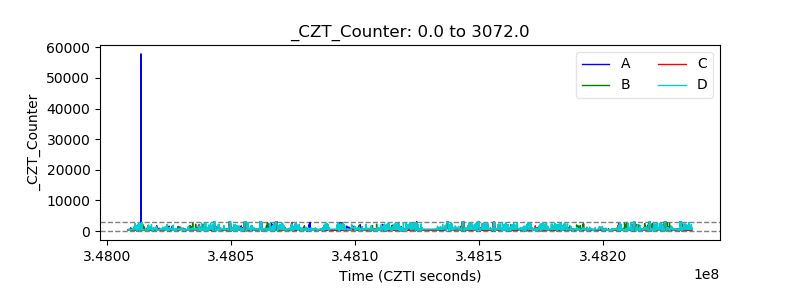 |
| +2.5 Volts monitor |  |
| +5 Volts monitor |  |
| _ROLL_ROT |  |
| _Roll_DEC |  |
| _Roll_RA |  |
| Veto Counter | 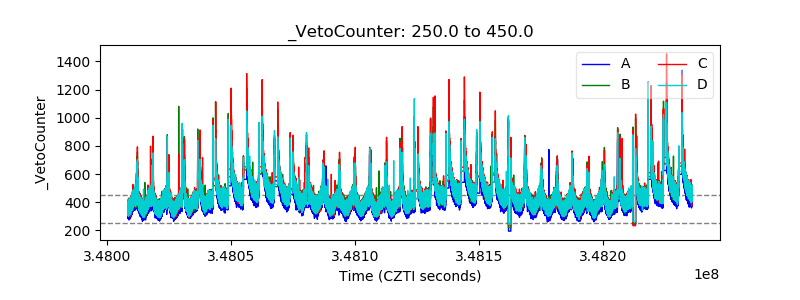 |