| Param | Original file | Final file |
|---|---|---|
| Filename | modeM0/AS1A10_102T07_9000004102cztM0_level2_bc.evt | modeM0/AS1A10_102T07_9000004102cztM0_level2_quad_clean.evt |
| Size (bytes) | 4,183,729,920 | 1,277,101,440 |
| Size | 3.9 GB | 1.2 GB |
| Events in quadrant A | 24,710,907 | 8,402,377 |
| Events in quadrant B | 23,003,612 | 8,428,649 |
| Events in quadrant C | 20,046,638 | 7,934,006 |
| Events in quadrant D | 52,591,280 | 7,515,772 |
| Mode M0 | |||
|---|---|---|---|
| Quadrant | BADHDUFLAG | Total packets | Discarded packets |
| A | 0 | 214892 | 0 |
| B | 0 | 207716 | 0 |
| C | 0 | 197740 | 0 |
| D | 0 | 303778 | 0 |
| Mode SS | |||
|---|---|---|---|
| Quadrant | BADHDUFLAG | Total packets | Discarded packets |
| A | 0 | 1902 | 0 |
| B | 0 | 1902 | 0 |
| C | 0 | 1902 | 0 |
| D | 0 | 1902 | 0 |
| Mode M9 | |||
|---|---|---|---|
| Quadrant | BADHDUFLAG | Total packets | Discarded packets |
| A | 0 | 157 | 0 |
| B | 0 | 157 | 0 |
| C | 0 | 157 | 0 |
| D | 0 | 157 | 0 |
| Quadrant | Total seconds | Saturated seconds | Saturation percentage |
|---|---|---|---|
| A | 93391 | 2271 | 2.431712% |
| B | 93391 | 2237 | 2.395306% |
| C | 93391 | 1651 | 1.767836% |
| D | 93391 | 7543 | 8.076795% |
Noise dominated data is calculated using 1-second bins in cleaned event files. If a bin has >2000 counts, and if more than 50% of those come from <1% of pixels, then it is considered to be noise-dominated and hence unusable.
| Quadrant | # 1 sec bins | Bins with >0 counts | Bins with >2000 counts | High rate bins dominated by noise | Noise dominated (total time) | Noise dominated (detector-on time) | Marked lightcurve |
|---|---|---|---|---|---|---|---|
| A | 116657 | 93381 | 50 | 50 | 0.04% | 0.05% |  |
| B | 116657 | 93378 | 14 | 14 | 0.01% | 0.01% |  |
| C | 116657 | 93379 | 4 | 4 | 0.00% | 0.00% | 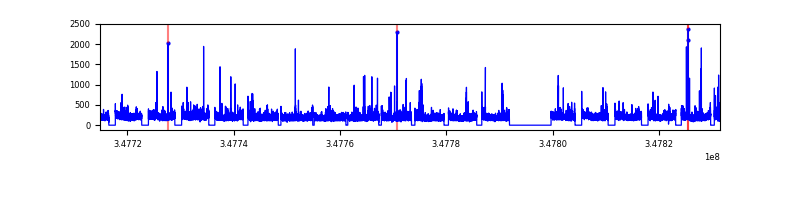 |
| D | 116657 | 93380 | 2367 | 2367 | 2.03% | 2.53% |  |
Top three noisy pixels from each quadrant. If the there are fewer than three noisy pixels in the level2.evt file, extra rows are filled as -1
| Pixel properties | Quadrant properties | ||||||
|---|---|---|---|---|---|---|---|
| Quadrant | DetID | PixID | Counts | Sigma | Mean | Median | Sigma |
| A | 15 | 174 | 3993494 | 3576.96 | 5196 | 5120 | 1115.0 |
| A | 14 | 238 | 503252 | 446.75 | 5196 | 5120 | 1115.0 |
| A | 13 | 254 | 158563 | 137.61 | 5196 | 5120 | 1115.0 |
| B | 10 | 245 | 1297464 | 1334.36 | 5198 | 5083 | 968.5 |
| B | 4 | 171 | 1052930 | 1081.88 | 5198 | 5083 | 968.5 |
| B | 0 | 230 | 270318 | 273.85 | 5198 | 5083 | 968.5 |
| C | 7 | 247 | 849404 | 736.81 | 4904 | 4882 | 1146.2 |
| C | 3 | 233 | 268651 | 230.13 | 4904 | 4882 | 1146.2 |
| C | 13 | 61 | 28073 | 20.23 | 4904 | 4882 | 1146.2 |
| D | 1 | 52 | 19424452 | 17382.22 | 4929 | 4781 | 1117.2 |
| D | 8 | 195 | 12424966 | 11117.1 | 4929 | 4781 | 1117.2 |
| D | 2 | 250 | 905238 | 805.98 | 4929 | 4781 | 1117.2 |
Histogram calculated using DETX and DETY for each event in the final _common_clean file
| Quadrant A | 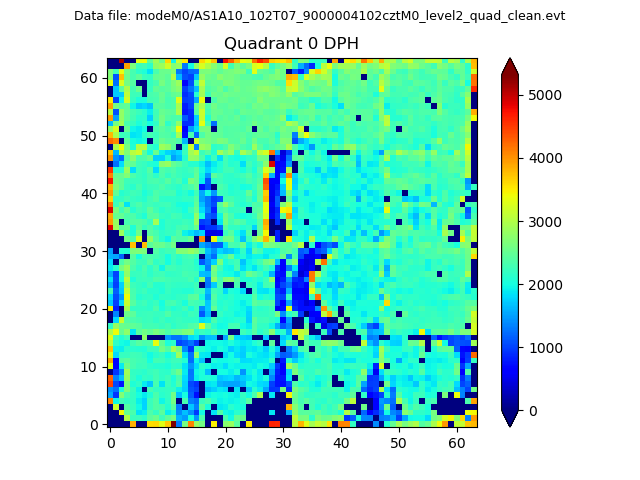 |
 |
Quadrant B |
|---|---|---|---|
| Quadrant D |  |
 |
Quadrant C |
| Plot type | Count rate plots | Images |
|---|---|---|
| Comparison with Poisson distribution Blue bars denote a histogram of data divided into 1 sec bins. Red curve is a Poisson curve with rate = median count rate of data. |
 |
 |
| Quadrant-wise count rates Data is divided into 100 sec bins |
 |
|
| Module-wise count rates for Quadrant A Data is divided into 100 sec bins |
 |
 |
| Module-wise count rates for Quadrant B Data is divided into 100 sec bins |
 |
 |
| Module-wise count rates for Quadrant C Data is divided into 100 sec bins |
 |
 |
| Module-wise count rates for Quadrant D Data is divided into 100 sec bins |
 |
 |
| Parameter | Plot |
|---|---|
| CZT HV Monitor |  |
| D_VDD |  |
| Temperature 1 |  |
| Veto HV Monitor |  |
| Veto LLD | 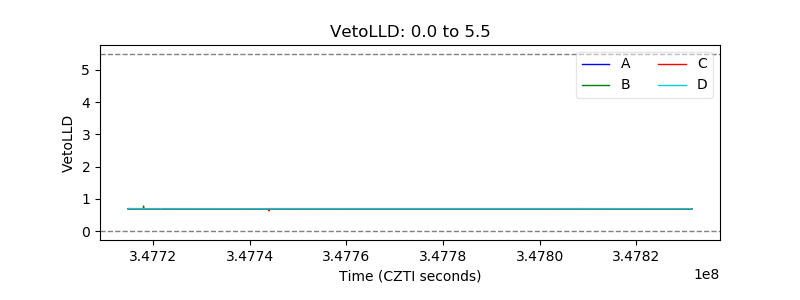 |
| Alpha Counter | 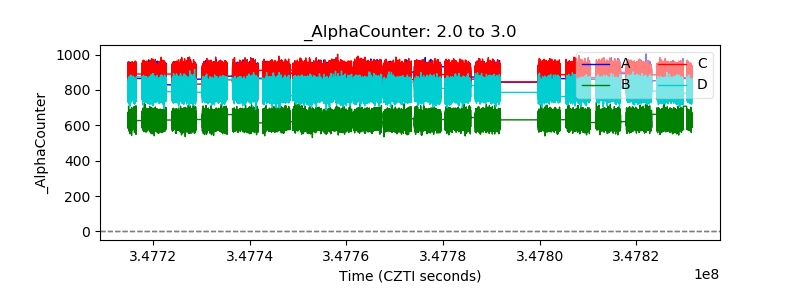 |
| _CPM_Rate |  |
| CZT Counter |  |
| +2.5 Volts monitor |  |
| +5 Volts monitor |  |
| _ROLL_ROT |  |
| _Roll_DEC | 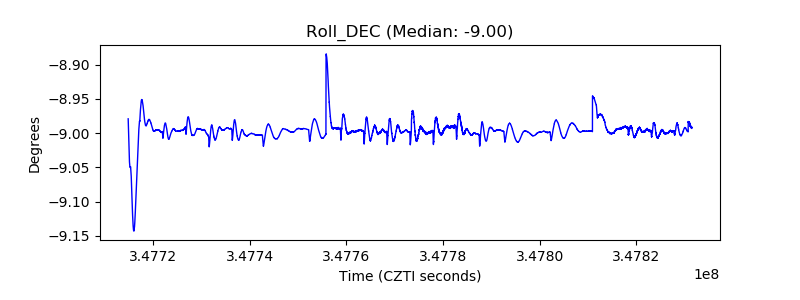 |
| _Roll_RA |  |
| Veto Counter |  |