| Param | Original file | Final file |
|---|---|---|
| Filename | modeM0/AS1A10_058T09_9000004100cztM0_level2_bc.evt | modeM0/AS1A10_058T09_9000004100cztM0_level2_quad_clean.evt |
| Size (bytes) | 6,175,310,400 | 1,789,568,640 |
| Size | 5.8 GB | 1.7 GB |
| Events in quadrant A | 36,518,489 | 11,576,976 |
| Events in quadrant B | 37,268,488 | 11,623,406 |
| Events in quadrant C | 28,862,061 | 11,194,045 |
| Events in quadrant D | 75,141,179 | 10,507,614 |
| Mode SS | |||
|---|---|---|---|
| Quadrant | BADHDUFLAG | Total packets | Discarded packets |
| A | 0 | 2762 | 0 |
| B | 0 | 2762 | 0 |
| C | 0 | 2762 | 0 |
| D | 0 | 2762 | 0 |
| Mode M9 | |||
|---|---|---|---|
| Quadrant | BADHDUFLAG | Total packets | Discarded packets |
| A | 0 | 226 | 0 |
| B | 0 | 226 | 0 |
| C | 0 | 226 | 0 |
| D | 0 | 226 | 0 |
| Mode M0 | |||
|---|---|---|---|
| Quadrant | BADHDUFLAG | Total packets | Discarded packets |
| A | 0 | 313563 | 0 |
| B | 0 | 316847 | 0 |
| C | 0 | 286962 | 0 |
| D | 0 | 449750 | 0 |
| Quadrant | Total seconds | Saturated seconds | Saturation percentage |
|---|---|---|---|
| A | 135766 | 3674 | 2.706127% |
| B | 135767 | 4532 | 3.338072% |
| C | 135767 | 2508 | 1.847282% |
| D | 135767 | 10555 | 7.774349% |
Noise dominated data is calculated using 1-second bins in cleaned event files. If a bin has >2000 counts, and if more than 50% of those come from <1% of pixels, then it is considered to be noise-dominated and hence unusable.
| Quadrant | # 1 sec bins | Bins with >0 counts | Bins with >2000 counts | High rate bins dominated by noise | Noise dominated (total time) | Noise dominated (detector-on time) | Marked lightcurve |
|---|---|---|---|---|---|---|---|
| A | 167607 | 135750 | 212 | 212 | 0.13% | 0.16% |  |
| B | 167607 | 135746 | 162 | 162 | 0.10% | 0.12% |  |
| C | 167607 | 135749 | 0 | 0 | 0.00% | 0.00% | 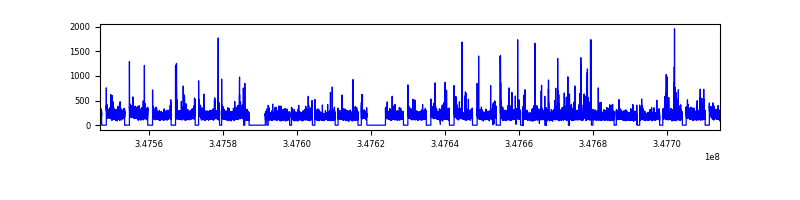 |
| D | 167607 | 135750 | 2167 | 2167 | 1.29% | 1.60% |  |
Top three noisy pixels from each quadrant. If the there are fewer than three noisy pixels in the level2.evt file, extra rows are filled as -1
| Pixel properties | Quadrant properties | ||||||
|---|---|---|---|---|---|---|---|
| Quadrant | DetID | PixID | Counts | Sigma | Mean | Median | Sigma |
| A | 15 | 174 | 7721138 | 4919.41 | 7354 | 7240 | 1568.1 |
| A | 13 | 254 | 246123 | 152.34 | 7354 | 7240 | 1568.1 |
| A | 1 | 113 | 99629 | 58.92 | 7354 | 7240 | 1568.1 |
| B | 10 | 245 | 6179790 | 4446.46 | 7392 | 7213 | 1388.2 |
| B | 0 | 230 | 770483 | 549.83 | 7392 | 7213 | 1388.2 |
| B | 4 | 171 | 507289 | 360.23 | 7392 | 7213 | 1388.2 |
| C | 3 | 233 | 1079960 | 650.68 | 7053 | 7031 | 1648.9 |
| C | 7 | 247 | 487098 | 291.14 | 7053 | 7031 | 1648.9 |
| C | 14 | 254 | 71879 | 39.33 | 7053 | 7031 | 1648.9 |
| D | 1 | 52 | 24524734 | 15246.45 | 7010 | 6783 | 1608.1 |
| D | 8 | 195 | 19302210 | 11998.83 | 7010 | 6783 | 1608.1 |
| D | 12 | 233 | 1621067 | 1003.84 | 7010 | 6783 | 1608.1 |
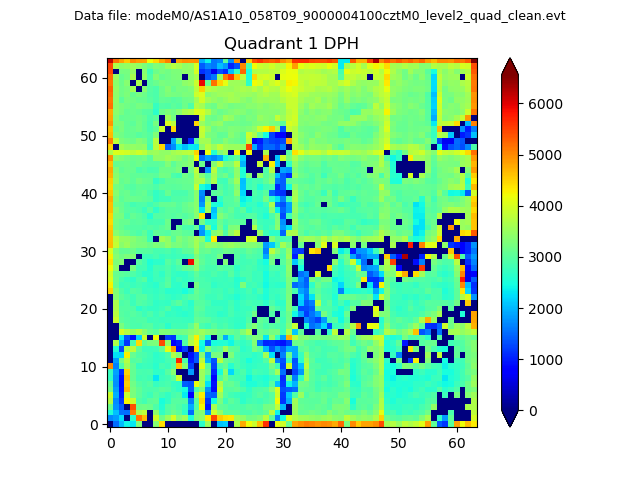
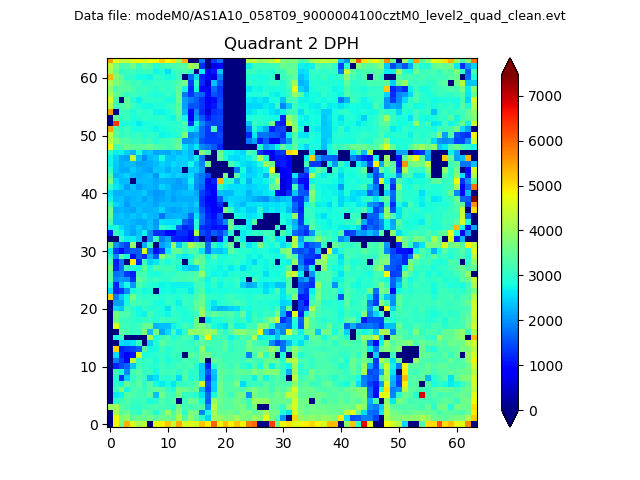
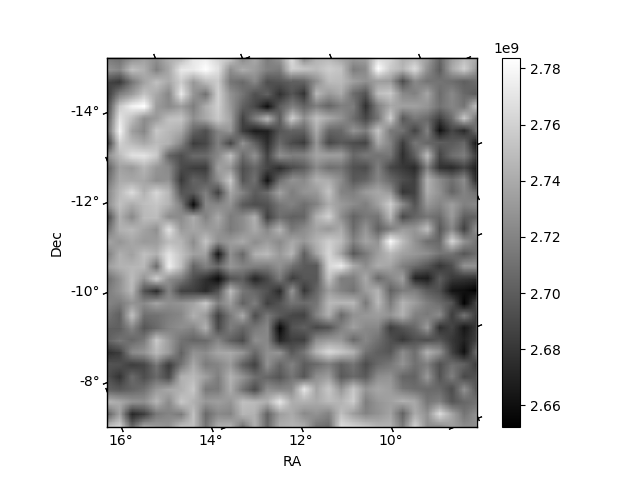
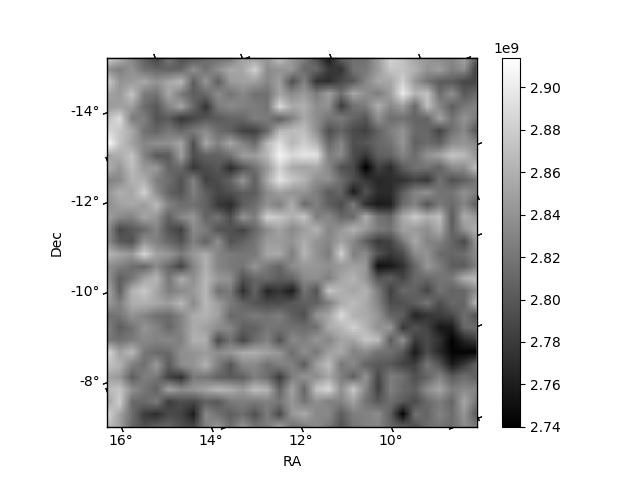
Histogram calculated using DETX and DETY for each event in the final _common_clean file
| Quadrant A |  |
 |
Quadrant B |
|---|---|---|---|
| Quadrant D | 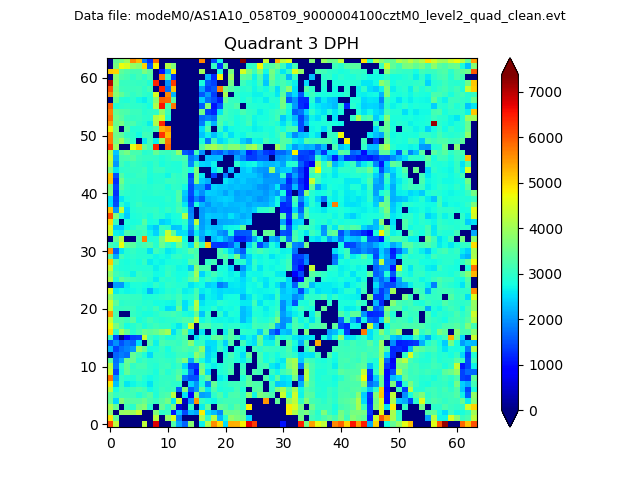 |
 |
Quadrant C |
| Plot type | Count rate plots | Images |
|---|---|---|
| Comparison with Poisson distribution Blue bars denote a histogram of data divided into 1 sec bins. Red curve is a Poisson curve with rate = median count rate of data. |
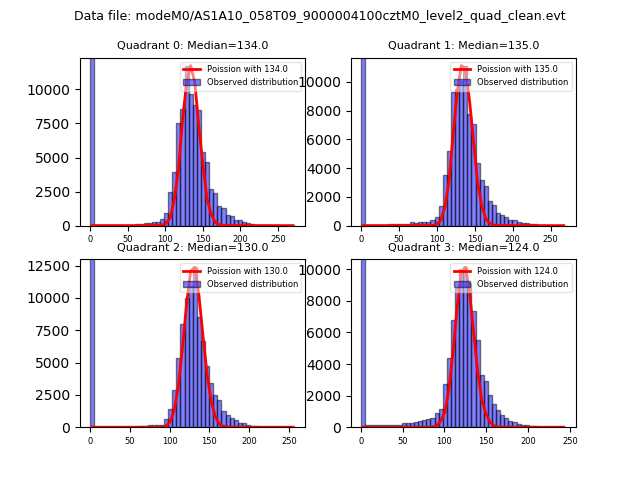 |
 |
| Quadrant-wise count rates Data is divided into 100 sec bins |
 |
|
| Module-wise count rates for Quadrant A Data is divided into 100 sec bins |
 |
 |
| Module-wise count rates for Quadrant B Data is divided into 100 sec bins |
 |
 |
| Module-wise count rates for Quadrant C Data is divided into 100 sec bins |
 |
 |
| Module-wise count rates for Quadrant D Data is divided into 100 sec bins |
 |
 |
| Parameter | Plot |
|---|---|
| CZT HV Monitor |  |
| D_VDD | 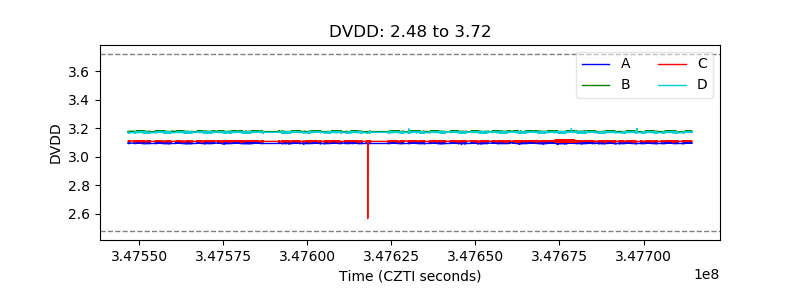 |
| Temperature 1 |  |
| Veto HV Monitor |  |
| Veto LLD |  |
| Alpha Counter |  |
| _CPM_Rate |  |
| CZT Counter | 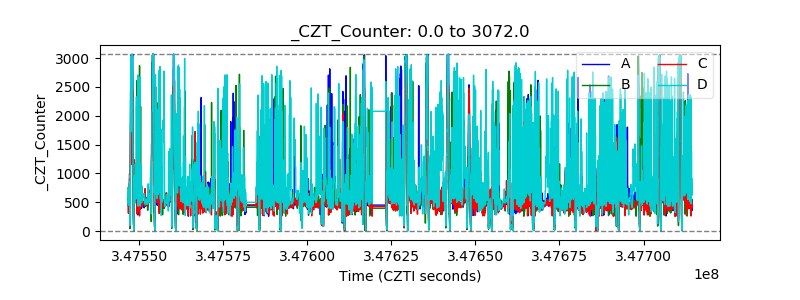 |
| +2.5 Volts monitor |  |
| +5 Volts monitor |  |
| _ROLL_ROT | 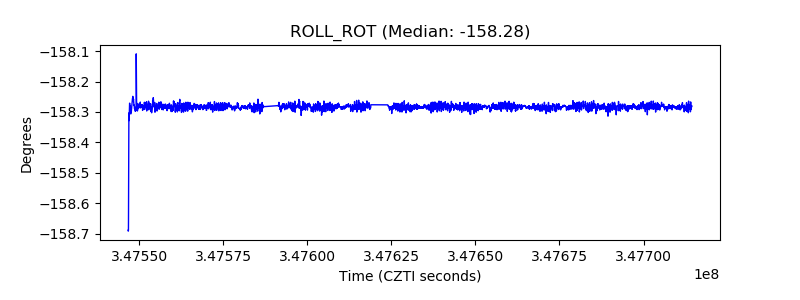 |
| _Roll_DEC | 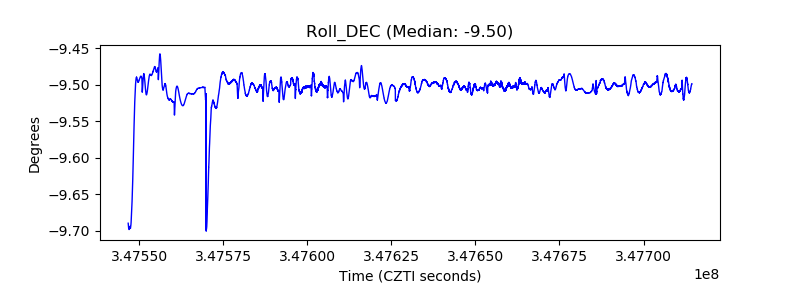 |
| _Roll_RA |  |
| Veto Counter | 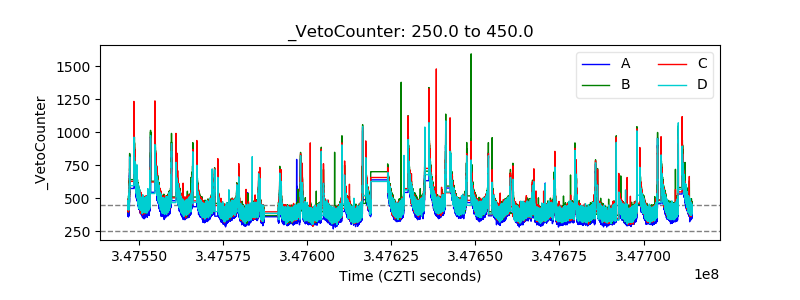 |