| Param | Original file | Final file |
|---|---|---|
| Filename | modeM0/AS1A10_123T03_9000004096cztM0_level2_bc.evt | modeM0/AS1A10_123T03_9000004096cztM0_level2_quad_clean.evt |
| Size (bytes) | 2,197,272,960 | 561,254,400 |
| Size | 2.0 GB | 535.3 MB |
| Events in quadrant A | 9,951,902 | 3,580,212 |
| Events in quadrant B | 10,519,746 | 3,647,804 |
| Events in quadrant C | 9,802,928 | 3,523,916 |
| Events in quadrant D | 33,235,795 | 3,189,345 |
| Mode M0 | |||
|---|---|---|---|
| Quadrant | BADHDUFLAG | Total packets | Discarded packets |
| A | 0 | 94756 | 0 |
| B | 0 | 96811 | 0 |
| C | 0 | 95646 | 0 |
| D | 0 | 181474 | 0 |
| Mode M9 | |||
|---|---|---|---|
| Quadrant | BADHDUFLAG | Total packets | Discarded packets |
| A | 0 | 77 | 0 |
| B | 0 | 77 | 0 |
| C | 0 | 77 | 0 |
| D | 0 | 77 | 0 |
| Mode SS | |||
|---|---|---|---|
| Quadrant | BADHDUFLAG | Total packets | Discarded packets |
| A | 0 | 906 | 0 |
| B | 0 | 906 | 0 |
| C | 0 | 906 | 0 |
| D | 0 | 906 | 0 |
| Quadrant | Total seconds | Saturated seconds | Saturation percentage |
|---|---|---|---|
| A | 44534 | 581 | 1.304621% |
| B | 44534 | 643 | 1.443841% |
| C | 44534 | 829 | 1.861499% |
| D | 44534 | 8850 | 19.872457% |
Noise dominated data is calculated using 1-second bins in cleaned event files. If a bin has >2000 counts, and if more than 50% of those come from <1% of pixels, then it is considered to be noise-dominated and hence unusable.
| Quadrant | # 1 sec bins | Bins with >0 counts | Bins with >2000 counts | High rate bins dominated by noise | Noise dominated (total time) | Noise dominated (detector-on time) | Marked lightcurve |
|---|---|---|---|---|---|---|---|
| A | 52114 | 44527 | 36 | 36 | 0.07% | 0.08% |  |
| B | 52114 | 44526 | 16 | 16 | 0.03% | 0.04% |  |
| C | 52114 | 44527 | 2 | 2 | 0.00% | 0.00% |  |
| D | 52114 | 44418 | 1662 | 1662 | 3.19% | 3.74% |  |
Top three noisy pixels from each quadrant. If the there are fewer than three noisy pixels in the level2.evt file, extra rows are filled as -1
| Pixel properties | Quadrant properties | ||||||
|---|---|---|---|---|---|---|---|
| Quadrant | DetID | PixID | Counts | Sigma | Mean | Median | Sigma |
| A | 15 | 169 | 153554 | 283.71 | 2509 | 2467 | 532.5 |
| A | 13 | 254 | 70980 | 128.65 | 2509 | 2467 | 532.5 |
| A | 12 | 96 | 67600 | 122.31 | 2509 | 2467 | 532.5 |
| B | 0 | 230 | 387494 | 816.5 | 2528 | 2470 | 471.6 |
| B | 5 | 255 | 230799 | 484.21 | 2528 | 2470 | 471.6 |
| B | 14 | 207 | 134590 | 280.18 | 2528 | 2470 | 471.6 |
| C | 7 | 247 | 216595 | 377.45 | 2443 | 2437 | 567.4 |
| C | 3 | 233 | 166106 | 288.46 | 2443 | 2437 | 567.4 |
| C | 8 | 128 | 15036 | 22.21 | 2443 | 2437 | 567.4 |
| D | 1 | 52 | 14567255 | 28028.46 | 2277 | 2205 | 519.7 |
| D | 8 | 195 | 8408300 | 16176.39 | 2277 | 2205 | 519.7 |
| D | 12 | 233 | 623925 | 1196.42 | 2277 | 2205 | 519.7 |
Histogram calculated using DETX and DETY for each event in the final _common_clean file
| Quadrant A |  |
 |
Quadrant B |
|---|---|---|---|
| Quadrant D |  |
 |
Quadrant C |
| Plot type | Count rate plots | Images |
|---|---|---|
| Comparison with Poisson distribution Blue bars denote a histogram of data divided into 1 sec bins. Red curve is a Poisson curve with rate = median count rate of data. |
 |
 |
| Quadrant-wise count rates Data is divided into 100 sec bins |
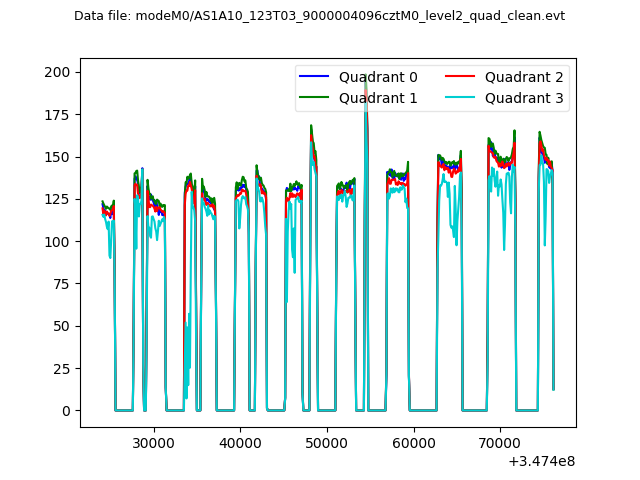 |
|
| Module-wise count rates for Quadrant A Data is divided into 100 sec bins |
 |
 |
| Module-wise count rates for Quadrant B Data is divided into 100 sec bins |
 |
 |
| Module-wise count rates for Quadrant C Data is divided into 100 sec bins |
 |
 |
| Module-wise count rates for Quadrant D Data is divided into 100 sec bins |
 |
 |
| Parameter | Plot |
|---|---|
| CZT HV Monitor |  |
| D_VDD |  |
| Temperature 1 | 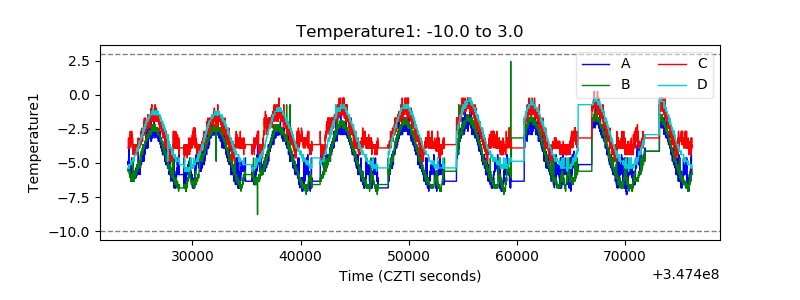 |
| Veto HV Monitor | 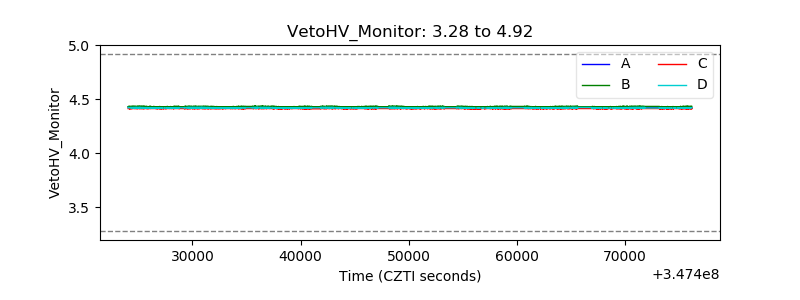 |
| Veto LLD |  |
| Alpha Counter |  |
| _CPM_Rate |  |
| CZT Counter |  |
| +2.5 Volts monitor |  |
| +5 Volts monitor | 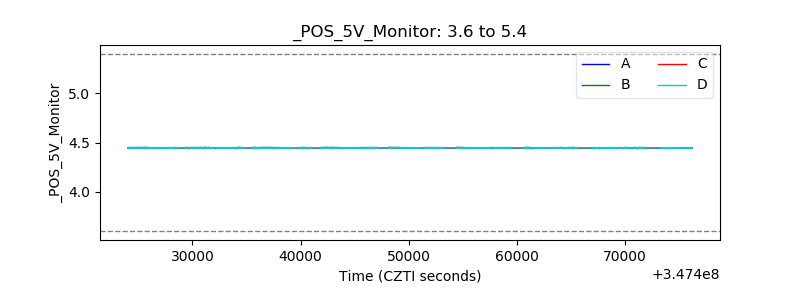 |
| _ROLL_ROT |  |
| _Roll_DEC |  |
| _Roll_RA |  |
| Veto Counter |  |