| Param | Original file | Final file |
|---|---|---|
| Filename | modeM0/AS1A10_110T05_9000004098cztM0_level2_bc.evt | modeM0/AS1A10_110T05_9000004098cztM0_level2_quad_clean.evt |
| Size (bytes) | 2,654,055,360 | 941,279,040 |
| Size | 2.5 GB | 897.7 MB |
| Events in quadrant A | 12,939,299 | 6,243,481 |
| Events in quadrant B | 13,775,725 | 6,336,588 |
| Events in quadrant C | 13,329,210 | 6,111,603 |
| Events in quadrant D | 36,249,538 | 5,704,755 |
| Mode M9 | |||
|---|---|---|---|
| Quadrant | BADHDUFLAG | Total packets | Discarded packets |
| A | 0 | 88 | 0 |
| B | 0 | 88 | 0 |
| C | 0 | 88 | 0 |
| D | 0 | 88 | 0 |
| Mode SS | |||
|---|---|---|---|
| Quadrant | BADHDUFLAG | Total packets | Discarded packets |
| A | 0 | 1220 | 0 |
| B | 0 | 1220 | 0 |
| C | 0 | 1220 | 0 |
| D | 0 | 1220 | 0 |
| Mode M0 | |||
|---|---|---|---|
| Quadrant | BADHDUFLAG | Total packets | Discarded packets |
| A | 0 | 125309 | 0 |
| B | 0 | 128307 | 0 |
| C | 0 | 127692 | 0 |
| D | 0 | 204722 | 0 |
| Quadrant | Total seconds | Saturated seconds | Saturation percentage |
|---|---|---|---|
| A | 59990 | 494 | 0.823471% |
| B | 59990 | 822 | 1.370228% |
| C | 59990 | 1145 | 1.908651% |
| D | 59990 | 6943 | 11.573596% |
Noise dominated data is calculated using 1-second bins in cleaned event files. If a bin has >2000 counts, and if more than 50% of those come from <1% of pixels, then it is considered to be noise-dominated and hence unusable.
| Quadrant | # 1 sec bins | Bins with >0 counts | Bins with >2000 counts | High rate bins dominated by noise | Noise dominated (total time) | Noise dominated (detector-on time) | Marked lightcurve |
|---|---|---|---|---|---|---|---|
| A | 68720 | 59986 | 0 | 0 | 0.00% | 0.00% | 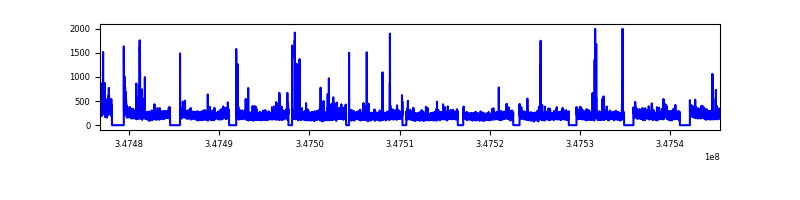 |
| B | 68720 | 59984 | 28 | 28 | 0.04% | 0.05% |  |
| C | 68720 | 59983 | 37 | 37 | 0.05% | 0.06% |  |
| D | 68720 | 59983 | 1634 | 1634 | 2.38% | 2.72% |  |
Top three noisy pixels from each quadrant. If the there are fewer than three noisy pixels in the level2.evt file, extra rows are filled as -1
| Pixel properties | Quadrant properties | ||||||
|---|---|---|---|---|---|---|---|
| Quadrant | DetID | PixID | Counts | Sigma | Mean | Median | Sigma |
| A | 15 | 174 | 413919 | 595.62 | 3191 | 3143 | 689.7 |
| A | 13 | 254 | 95761 | 134.29 | 3191 | 3143 | 689.7 |
| A | 12 | 96 | 94426 | 132.36 | 3191 | 3143 | 689.7 |
| B | 10 | 245 | 642455 | 1055.52 | 3214 | 3140 | 605.7 |
| B | 0 | 230 | 408254 | 668.85 | 3214 | 3140 | 605.7 |
| B | 5 | 255 | 157537 | 254.91 | 3214 | 3140 | 605.7 |
| C | 4 | 254 | 728114 | 993.04 | 3091 | 3080 | 730.1 |
| C | 3 | 233 | 366630 | 497.94 | 3091 | 3080 | 730.1 |
| C | 7 | 247 | 206747 | 278.95 | 3091 | 3080 | 730.1 |
| D | 8 | 195 | 12143213 | 17192.81 | 3030 | 2936 | 706.1 |
| D | 1 | 52 | 10398501 | 14721.99 | 3030 | 2936 | 706.1 |
| D | 12 | 233 | 871061 | 1229.42 | 3030 | 2936 | 706.1 |
Histogram calculated using DETX and DETY for each event in the final _common_clean file
| Quadrant A |  |
 |
Quadrant B |
|---|---|---|---|
| Quadrant D |  |
 |
Quadrant C |
| Plot type | Count rate plots | Images |
|---|---|---|
| Comparison with Poisson distribution Blue bars denote a histogram of data divided into 1 sec bins. Red curve is a Poisson curve with rate = median count rate of data. |
 |
 |
| Quadrant-wise count rates Data is divided into 100 sec bins |
 |
|
| Module-wise count rates for Quadrant A Data is divided into 100 sec bins |
 |
 |
| Module-wise count rates for Quadrant B Data is divided into 100 sec bins |
 |
 |
| Module-wise count rates for Quadrant C Data is divided into 100 sec bins |
 |
 |
| Module-wise count rates for Quadrant D Data is divided into 100 sec bins |
 |
 |
| Parameter | Plot |
|---|---|
| CZT HV Monitor |  |
| D_VDD |  |
| Temperature 1 |  |
| Veto HV Monitor |  |
| Veto LLD | 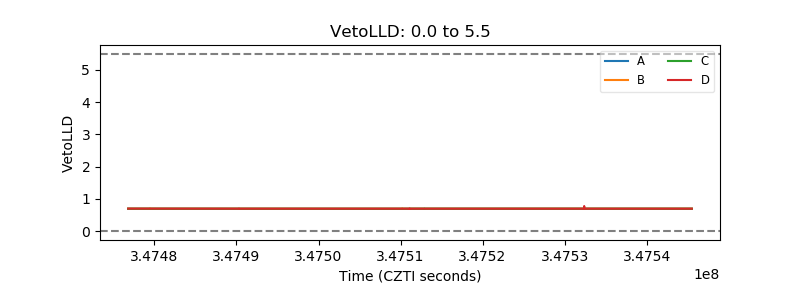 |
| Alpha Counter |  |
| _CPM_Rate |  |
| CZT Counter |  |
| +2.5 Volts monitor |  |
| +5 Volts monitor |  |
| _ROLL_ROT |  |
| _Roll_DEC |  |
| _Roll_RA |  |
| Veto Counter |  |