| Param | Original file | Final file |
|---|---|---|
| Filename | modeM0/AS1A10_110T04_9000004094cztM0_level2_bc.evt | modeM0/AS1A10_110T04_9000004094cztM0_level2_quad_clean.evt |
| Size (bytes) | 3,097,454,400 | 744,837,120 |
| Size | 2.9 GB | 710.3 MB |
| Events in quadrant A | 14,291,997 | 4,888,740 |
| Events in quadrant B | 25,864,068 | 4,846,587 |
| Events in quadrant C | 12,442,466 | 4,832,908 |
| Events in quadrant D | 37,532,609 | 4,284,864 |
| Mode M0 | |||
|---|---|---|---|
| Quadrant | BADHDUFLAG | Total packets | Discarded packets |
| A | 0 | 124062 | 0 |
| B | 0 | 175161 | 0 |
| C | 0 | 118261 | 0 |
| D | 0 | 211416 | 0 |
| Mode SS | |||
|---|---|---|---|
| Quadrant | BADHDUFLAG | Total packets | Discarded packets |
| A | 0 | 1100 | 0 |
| B | 0 | 1100 | 0 |
| C | 0 | 1100 | 0 |
| D | 0 | 1100 | 0 |
| Mode M9 | |||
|---|---|---|---|
| Quadrant | BADHDUFLAG | Total packets | Discarded packets |
| A | 0 | 98 | 0 |
| B | 0 | 98 | 0 |
| C | 0 | 98 | 0 |
| D | 0 | 98 | 0 |
| Quadrant | Total seconds | Saturated seconds | Saturation percentage |
|---|---|---|---|
| A | 53997 | 1353 | 2.505695% |
| B | 53997 | 7350 | 13.611867% |
| C | 53997 | 1303 | 2.413097% |
| D | 53997 | 10451 | 19.354779% |
Noise dominated data is calculated using 1-second bins in cleaned event files. If a bin has >2000 counts, and if more than 50% of those come from <1% of pixels, then it is considered to be noise-dominated and hence unusable.
| Quadrant | # 1 sec bins | Bins with >0 counts | Bins with >2000 counts | High rate bins dominated by noise | Noise dominated (total time) | Noise dominated (detector-on time) | Marked lightcurve |
|---|---|---|---|---|---|---|---|
| A | 63326 | 53988 | 67 | 67 | 0.11% | 0.12% | 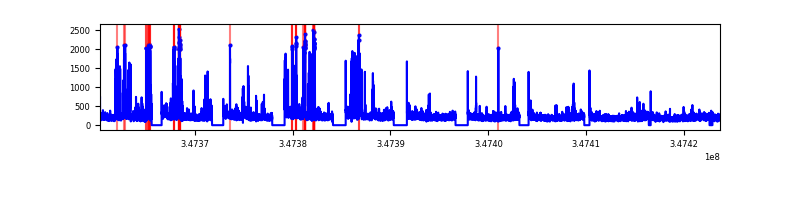 |
| B | 63326 | 53984 | 319 | 319 | 0.50% | 0.59% |  |
| C | 63326 | 53986 | 52 | 52 | 0.08% | 0.10% |  |
| D | 63326 | 53979 | 2083 | 2083 | 3.29% | 3.86% | 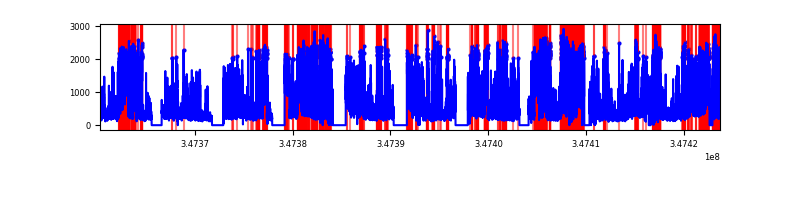 |
Top three noisy pixels from each quadrant. If the there are fewer than three noisy pixels in the level2.evt file, extra rows are filled as -1
| Pixel properties | Quadrant properties | ||||||
|---|---|---|---|---|---|---|---|
| Quadrant | DetID | PixID | Counts | Sigma | Mean | Median | Sigma |
| A | 15 | 174 | 2311800 | 3541.66 | 3074 | 3028 | 651.9 |
| A | 13 | 254 | 85585 | 126.64 | 3074 | 3028 | 651.9 |
| A | 1 | 113 | 51951 | 75.05 | 3074 | 3028 | 651.9 |
| B | 10 | 245 | 13755888 | 25318.29 | 2932 | 2876 | 543.2 |
| B | 10 | 246 | 606535 | 1111.29 | 2932 | 2876 | 543.2 |
| B | 0 | 230 | 115174 | 206.73 | 2932 | 2876 | 543.2 |
| C | 7 | 247 | 393131 | 561.12 | 3013 | 3011 | 695.2 |
| C | 7 | 238 | 231067 | 328.02 | 3013 | 3011 | 695.2 |
| C | 3 | 233 | 180181 | 254.83 | 3013 | 3011 | 695.2 |
| D | 1 | 52 | 12380674 | 19404.35 | 2795 | 2710 | 637.9 |
| D | 8 | 195 | 9284160 | 14550.09 | 2795 | 2710 | 637.9 |
| D | 12 | 79 | 3207186 | 5023.51 | 2795 | 2710 | 637.9 |
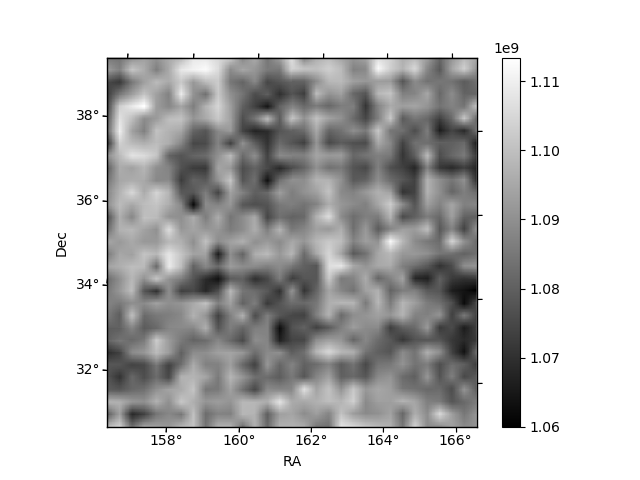
Histogram calculated using DETX and DETY for each event in the final _common_clean file
| Quadrant A | 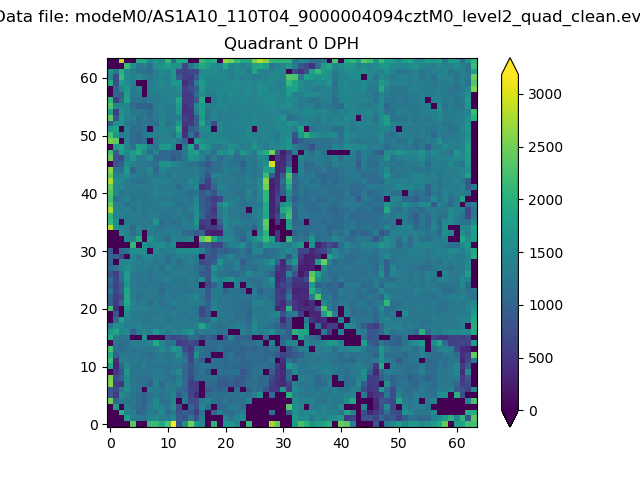 |
 |
Quadrant B |
|---|---|---|---|
| Quadrant D |  |
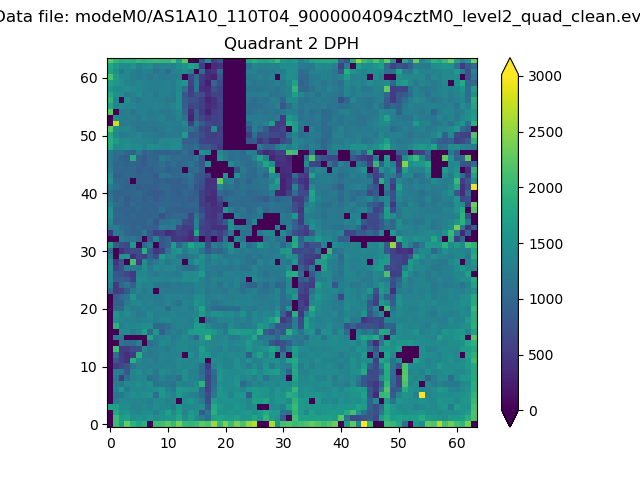 |
Quadrant C |
| Plot type | Count rate plots | Images |
|---|---|---|
| Comparison with Poisson distribution Blue bars denote a histogram of data divided into 1 sec bins. Red curve is a Poisson curve with rate = median count rate of data. |
 |
 |
| Quadrant-wise count rates Data is divided into 100 sec bins |
 |
|
| Module-wise count rates for Quadrant A Data is divided into 100 sec bins |
 |
 |
| Module-wise count rates for Quadrant B Data is divided into 100 sec bins |
 |
 |
| Module-wise count rates for Quadrant C Data is divided into 100 sec bins |
 |
 |
| Module-wise count rates for Quadrant D Data is divided into 100 sec bins |
 |
 |
| Parameter | Plot |
|---|---|
| CZT HV Monitor |  |
| D_VDD |  |
| Temperature 1 |  |
| Veto HV Monitor |  |
| Veto LLD |  |
| Alpha Counter | 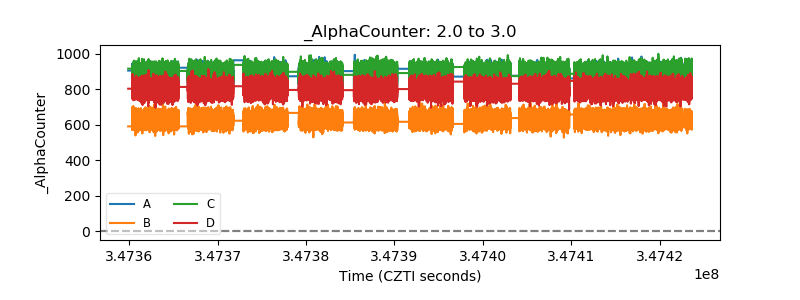 |
| _CPM_Rate |  |
| CZT Counter | 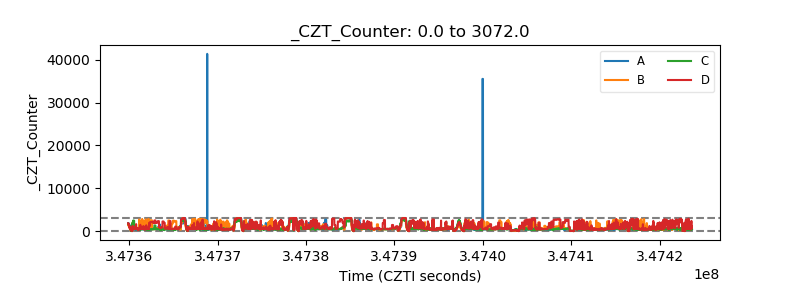 |
| +2.5 Volts monitor |  |
| +5 Volts monitor |  |
| _ROLL_ROT | 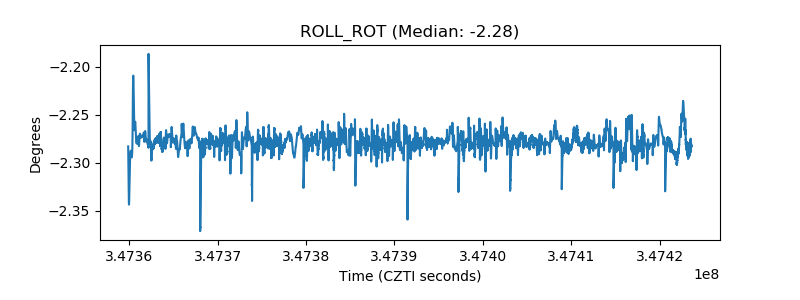 |
| _Roll_DEC | 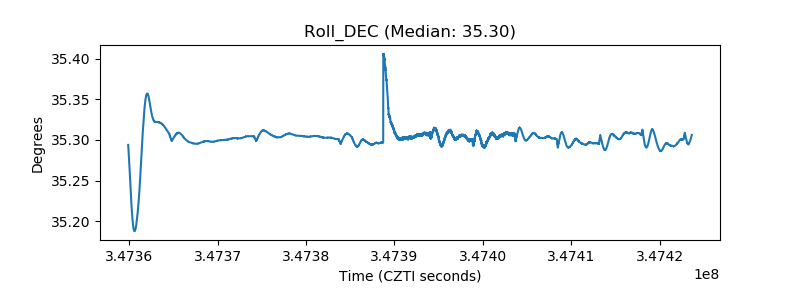 |
| _Roll_RA | 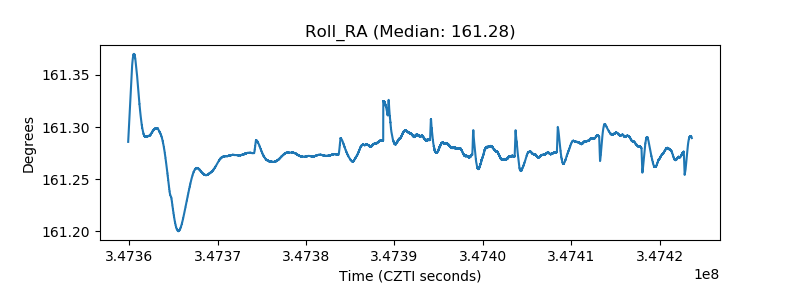 |
| Veto Counter |  |