| Param | Original file | Final file |
|---|---|---|
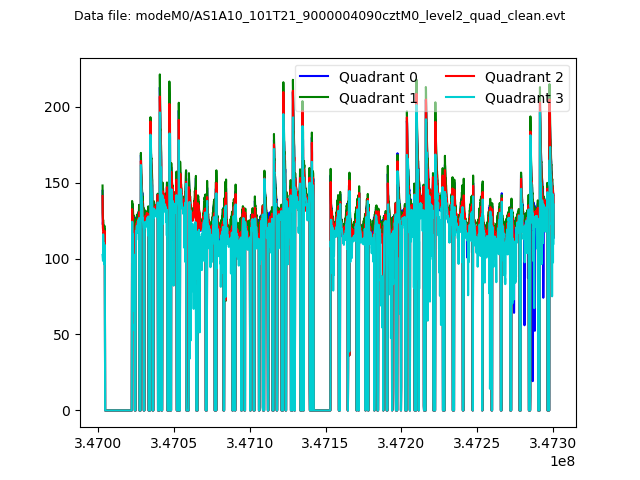
| Filename | modeM0/AS1A10_101T21_9000004090cztM0_level2_bc.evt | modeM0/AS1A10_101T21_9000004090cztM0_level2_quad_clean.evt |
| Size (bytes) | 10,282,654,080 | 4,287,571,200 |
| Size | 9.6 GB | 4.0 GB |
| Events in quadrant A | 54,406,352 | 29,093,301 |
| Events in quadrant B | 54,500,424 | 29,669,165 |
| Events in quadrant C | 50,940,093 | 28,673,750 |
| Events in quadrant D | 135,816,508 | 26,575,921 |
| Mode M0 | |||
|---|---|---|---|
| Quadrant | BADHDUFLAG | Total packets | Discarded packets |
| A | 0 | 504031 | 0 |
| B | 0 | 497677 | 0 |
| C | 0 | 494286 | 0 |
| D | 0 | 784277 | 0 |
| Mode SS | |||
|---|---|---|---|
| Quadrant | BADHDUFLAG | Total packets | Discarded packets |
| A | 0 | 4618 | 0 |
| B | 0 | 4714 | 0 |
| C | 0 | 4714 | 0 |
| D | 0 | 4714 | 0 |
| Mode M9 | |||
|---|---|---|---|
| Quadrant | BADHDUFLAG | Total packets | Discarded packets |
| A | 0 | 371 | 0 |
| B | 0 | 372 | 0 |
| C | 0 | 372 | 0 |
| D | 0 | 372 | 0 |
| Quadrant | Total seconds | Saturated seconds | Saturation percentage |
|---|---|---|---|
| A | 231672 | 4072 | 1.757657% |
| B | 231672 | 3151 | 1.360113% |
| C | 231672 | 4178 | 1.803412% |
| D | 231671 | 27426 | 11.838340% |
Noise dominated data is calculated using 1-second bins in cleaned event files. If a bin has >2000 counts, and if more than 50% of those come from <1% of pixels, then it is considered to be noise-dominated and hence unusable.
| Quadrant | # 1 sec bins | Bins with >0 counts | Bins with >2000 counts | High rate bins dominated by noise | Noise dominated (total time) | Noise dominated (detector-on time) | Marked lightcurve |
|---|---|---|---|---|---|---|---|
| A | 297585 | 231651 | 193 | 193 | 0.06% | 0.08% |  |
| B | 297585 | 231646 | 85 | 85 | 0.03% | 0.04% |  |
| C | 297585 | 231648 | 50 | 50 | 0.02% | 0.02% | 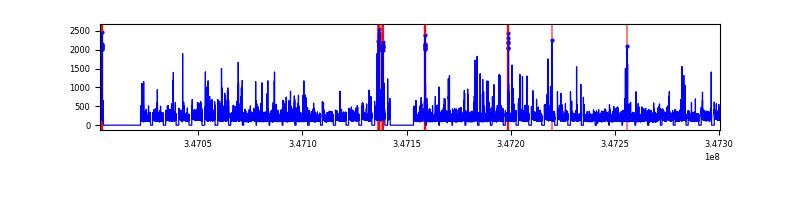 |
| D | 297585 | 231646 | 7802 | 7802 | 2.62% | 3.37% | 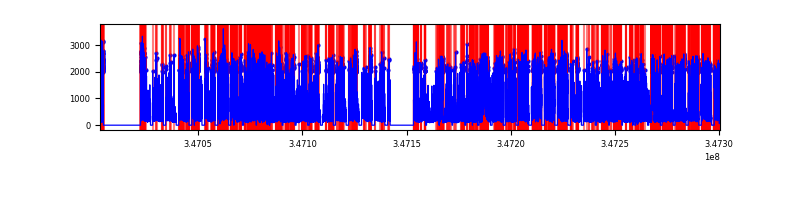 |
Top three noisy pixels from each quadrant. If the there are fewer than three noisy pixels in the level2.evt file, extra rows are filled as -1
| Pixel properties | Quadrant properties | ||||||
|---|---|---|---|---|---|---|---|
| Quadrant | DetID | PixID | Counts | Sigma | Mean | Median | Sigma |
| A | 15 | 174 | 5721976 | 2147.02 | 12443 | 12280 | 2659.4 |
| A | 13 | 254 | 343557 | 124.57 | 12443 | 12280 | 2659.4 |
| A | 15 | 169 | 155635 | 53.91 | 12443 | 12280 | 2659.4 |
| B | 10 | 245 | 3795372 | 1602.08 | 12591 | 12333 | 2361.3 |
| B | 0 | 183 | 609522 | 252.9 | 12591 | 12333 | 2361.3 |
| B | 0 | 230 | 571140 | 236.65 | 12591 | 12333 | 2361.3 |
| C | 7 | 220 | 2077436 | 716.88 | 12175 | 12145 | 2881.0 |
| C | 3 | 233 | 1067810 | 366.43 | 12175 | 12145 | 2881.0 |
| C | 7 | 247 | 750076 | 256.14 | 12175 | 12145 | 2881.0 |
| D | 1 | 52 | 44447097 | 16311.95 | 11858 | 11501 | 2724.1 |
| D | 8 | 195 | 35934109 | 13186.9 | 11858 | 11501 | 2724.1 |
| D | 2 | 250 | 5016738 | 1837.38 | 11858 | 11501 | 2724.1 |
Histogram calculated using DETX and DETY for each event in the final _common_clean file
| Quadrant A | 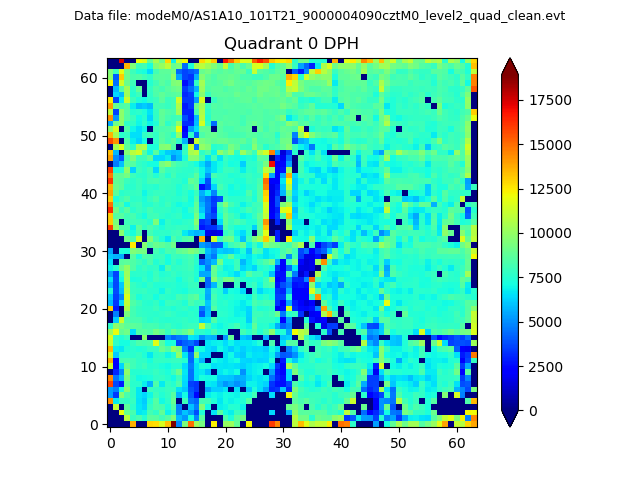 |
 |
Quadrant B |
|---|---|---|---|
| Quadrant D |  |
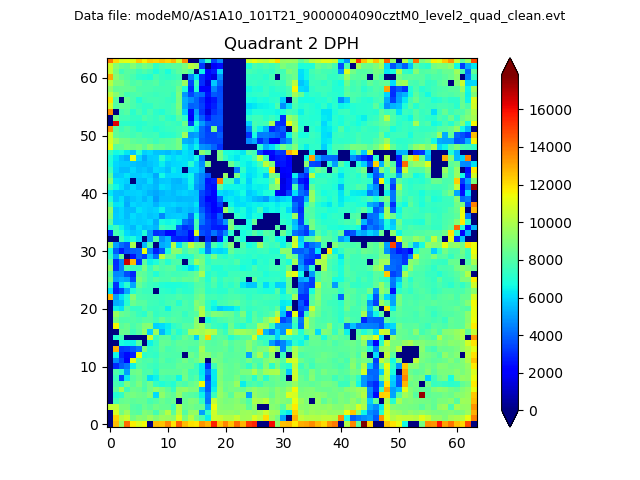 |
Quadrant C |
| Plot type | Count rate plots | Images |
|---|---|---|
| Comparison with Poisson distribution Blue bars denote a histogram of data divided into 1 sec bins. Red curve is a Poisson curve with rate = median count rate of data. |
 |
 |
| Quadrant-wise count rates Data is divided into 100 sec bins |
 |
|
| Module-wise count rates for Quadrant A Data is divided into 100 sec bins |
 |
 |
| Module-wise count rates for Quadrant B Data is divided into 100 sec bins |
 |
 |
| Module-wise count rates for Quadrant C Data is divided into 100 sec bins |
 |
 |
| Module-wise count rates for Quadrant D Data is divided into 100 sec bins |
 |
 |
| Parameter | Plot |
|---|---|
| CZT HV Monitor |  |
| D_VDD |  |
| Temperature 1 |  |
| Veto HV Monitor | 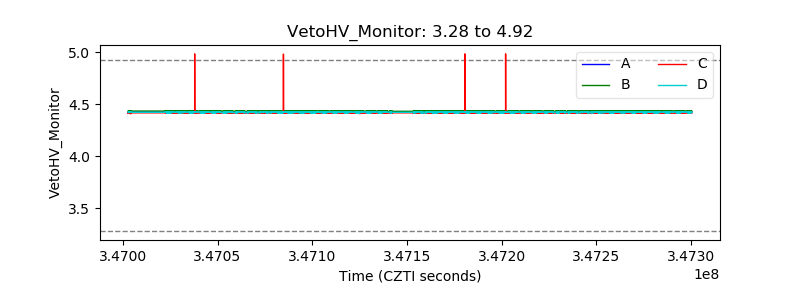 |
| Veto LLD |  |
| Alpha Counter |  |
| _CPM_Rate |  |
| CZT Counter |  |
| +2.5 Volts monitor | 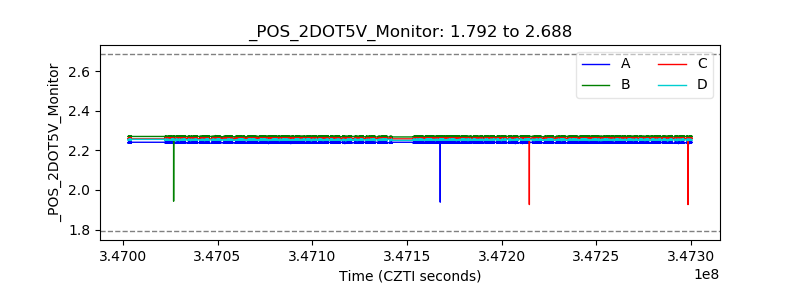 |
| +5 Volts monitor |  |
| _ROLL_ROT |  |
| _Roll_DEC |  |
| _Roll_RA |  |
| Veto Counter | 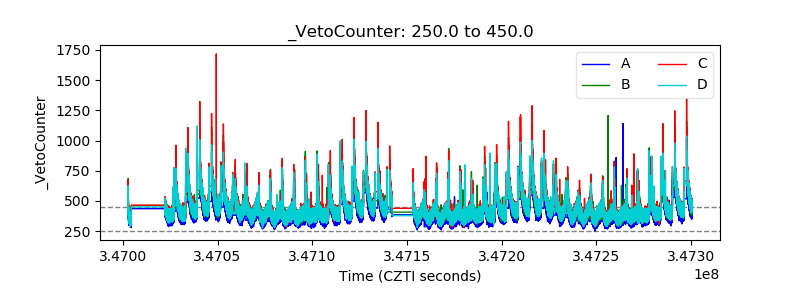 |