| Param | Original file | Final file |
|---|---|---|
| Filename | modeM0/AS1A10_058T13_9000004088cztM0_level2_bc.evt | modeM0/AS1A10_058T13_9000004088cztM0_level2_quad_clean.evt |
| Size (bytes) | 5,232,467,520 | 1,573,516,800 |
| Size | 4.9 GB | 1.5 GB |
| Events in quadrant A | 26,492,763 | 10,098,901 |
| Events in quadrant B | 32,144,968 | 10,250,560 |
| Events in quadrant C | 25,429,947 | 9,748,125 |
| Events in quadrant D | 66,019,406 | 9,121,674 |
| Mode SS | |||
|---|---|---|---|
| Quadrant | BADHDUFLAG | Total packets | Discarded packets |
| A | 0 | 2508 | 0 |
| B | 0 | 2508 | 0 |
| C | 0 | 2508 | 0 |
| D | 0 | 2508 | 0 |
| Mode M0 | |||
|---|---|---|---|
| Quadrant | BADHDUFLAG | Total packets | Discarded packets |
| A | 0 | 258409 | 0 |
| B | 0 | 276538 | 0 |
| C | 0 | 258313 | 0 |
| D | 0 | 389940 | 0 |
| Mode M9 | |||
|---|---|---|---|
| Quadrant | BADHDUFLAG | Total packets | Discarded packets |
| A | 0 | 205 | 0 |
| B | 0 | 205 | 0 |
| C | 0 | 205 | 0 |
| D | 0 | 205 | 0 |
| Quadrant | Total seconds | Saturated seconds | Saturation percentage |
|---|---|---|---|
| A | 123167 | 1534 | 1.245463% |
| B | 123167 | 2537 | 2.059805% |
| C | 123167 | 2214 | 1.797559% |
| D | 123167 | 9360 | 7.599438% |
Noise dominated data is calculated using 1-second bins in cleaned event files. If a bin has >2000 counts, and if more than 50% of those come from <1% of pixels, then it is considered to be noise-dominated and hence unusable.
| Quadrant | # 1 sec bins | Bins with >0 counts | Bins with >2000 counts | High rate bins dominated by noise | Noise dominated (total time) | Noise dominated (detector-on time) | Marked lightcurve |
|---|---|---|---|---|---|---|---|
| A | 142836 | 123156 | 23 | 23 | 0.02% | 0.02% |  |
| B | 142836 | 123153 | 151 | 151 | 0.11% | 0.12% |  |
| C | 142836 | 123163 | 6 | 6 | 0.00% | 0.00% |  |
| D | 142836 | 123159 | 2426 | 2426 | 1.70% | 1.97% |  |
Top three noisy pixels from each quadrant. If the there are fewer than three noisy pixels in the level2.evt file, extra rows are filled as -1
| Pixel properties | Quadrant properties | ||||||
|---|---|---|---|---|---|---|---|
| Quadrant | DetID | PixID | Counts | Sigma | Mean | Median | Sigma |
| A | 6 | 16 | 184549 | 123.89 | 6736 | 6613 | 1436.3 |
| A | 13 | 254 | 181827 | 121.99 | 6736 | 6613 | 1436.3 |
| A | 15 | 174 | 93690 | 60.63 | 6736 | 6613 | 1436.3 |
| B | 10 | 245 | 4910695 | 3832.53 | 6829 | 6657 | 1279.6 |
| B | 0 | 230 | 385699 | 296.22 | 6829 | 6657 | 1279.6 |
| B | 10 | 246 | 347763 | 266.58 | 6829 | 6657 | 1279.6 |
| C | 7 | 220 | 387796 | 253.05 | 6471 | 6443 | 1507.0 |
| C | 1 | 16 | 86568 | 53.17 | 6471 | 6443 | 1507.0 |
| C | 13 | 61 | 37295 | 20.47 | 6471 | 6443 | 1507.0 |
| D | 8 | 195 | 18669477 | 12856.26 | 6384 | 6176 | 1451.7 |
| D | 1 | 52 | 18592556 | 12803.27 | 6384 | 6176 | 1451.7 |
| D | 2 | 250 | 2661874 | 1829.38 | 6384 | 6176 | 1451.7 |
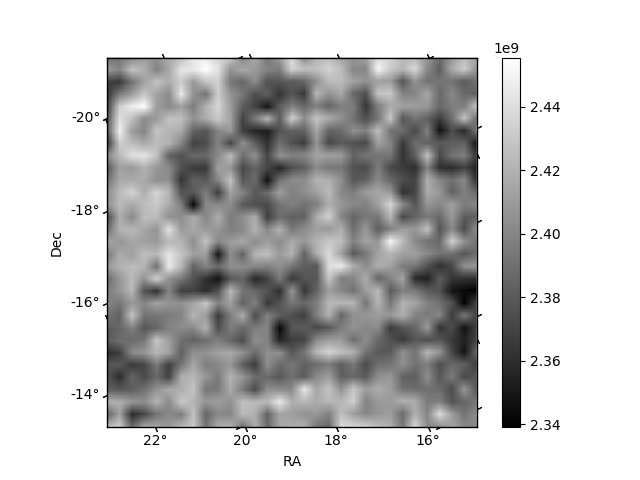
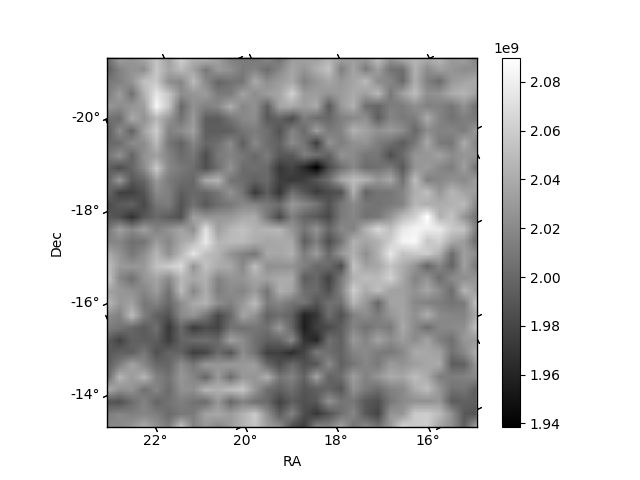
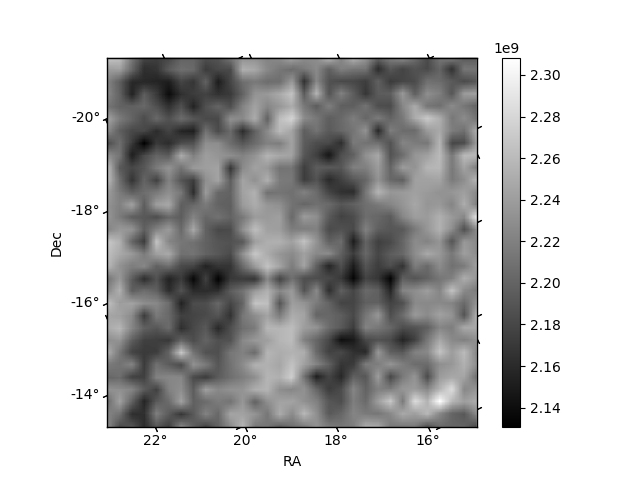
Histogram calculated using DETX and DETY for each event in the final _common_clean file
| Quadrant A |  |
 |
Quadrant B |
|---|---|---|---|
| Quadrant D |  |
 |
Quadrant C |
| Plot type | Count rate plots | Images |
|---|---|---|
| Comparison with Poisson distribution Blue bars denote a histogram of data divided into 1 sec bins. Red curve is a Poisson curve with rate = median count rate of data. |
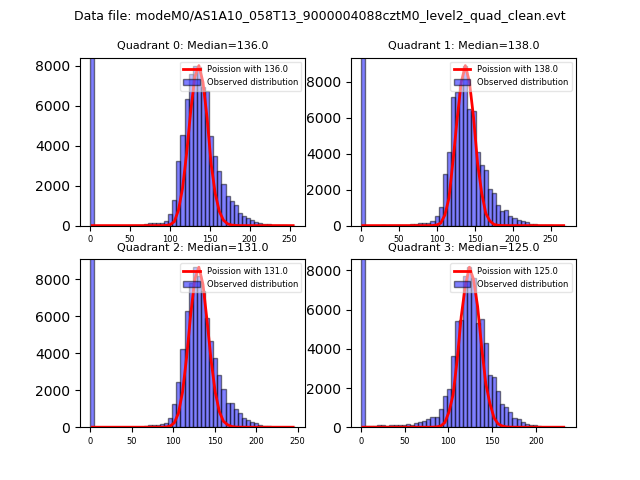 |
 |
| Quadrant-wise count rates Data is divided into 100 sec bins |
 |
|
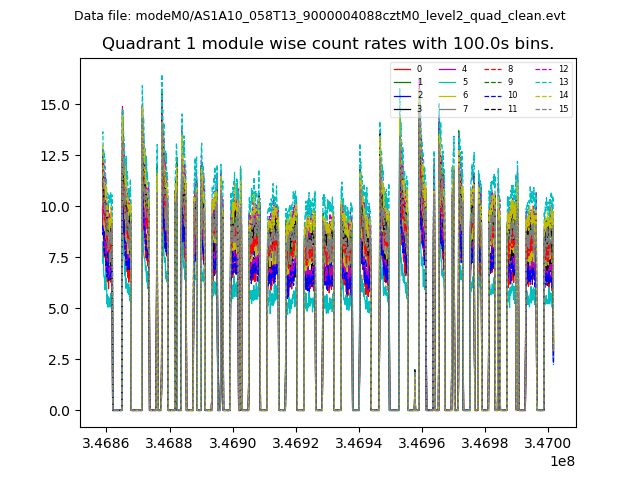
| Module-wise count rates for Quadrant A Data is divided into 100 sec bins |
 |
 |
| Module-wise count rates for Quadrant B Data is divided into 100 sec bins |
 |
 |
| Module-wise count rates for Quadrant C Data is divided into 100 sec bins |
 |
 |
| Module-wise count rates for Quadrant D Data is divided into 100 sec bins |
 |
 |
| Parameter | Plot |
|---|---|
| CZT HV Monitor |  |
| D_VDD |  |
| Temperature 1 |  |
| Veto HV Monitor |  |
| Veto LLD |  |
| Alpha Counter |  |
| _CPM_Rate |  |
| CZT Counter |  |
| +2.5 Volts monitor |  |
| +5 Volts monitor | 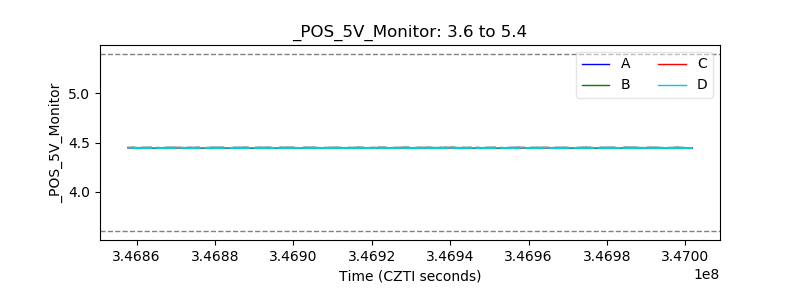 |
| _ROLL_ROT |  |
| _Roll_DEC | 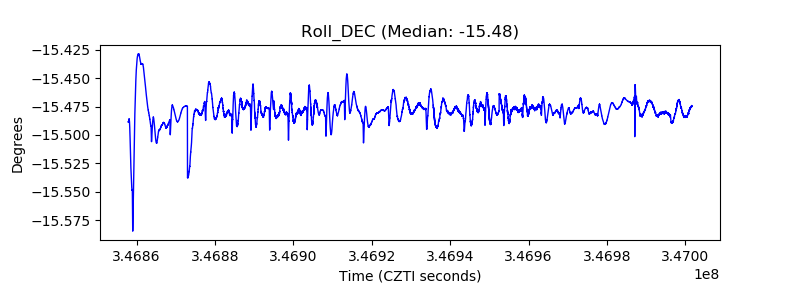 |
| _Roll_RA | 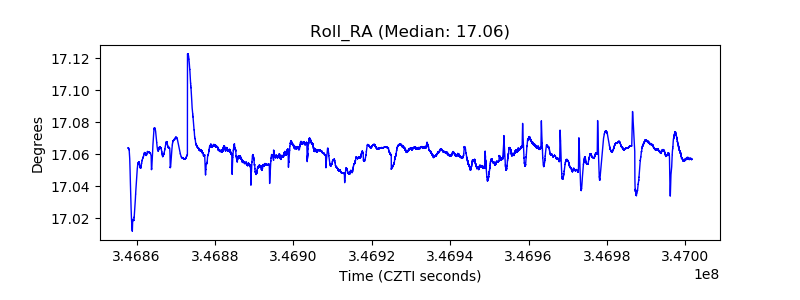 |
| Veto Counter | 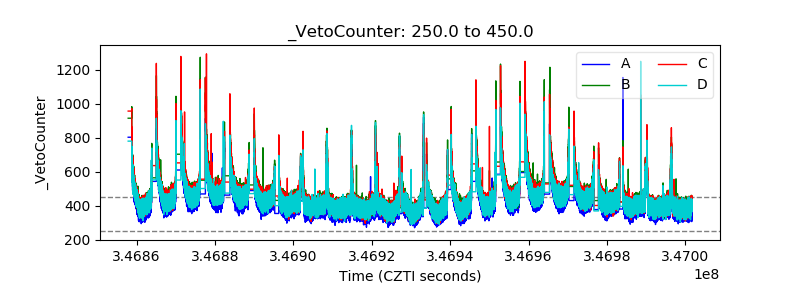 |