| Param | Original file | Final file |
|---|---|---|
| Filename | modeM0/AS1A10_045T05_9000004086cztM0_level2_bc.evt | modeM0/AS1A10_045T05_9000004086cztM0_level2_quad_clean.evt |
| Size (bytes) | 3,382,951,680 | 1,022,808,960 |
| Size | 3.2 GB | 975.4 MB |
| Events in quadrant A | 16,391,185 | 6,515,869 |
| Events in quadrant B | 19,298,320 | 6,697,888 |
| Events in quadrant C | 15,955,453 | 6,467,463 |
| Events in quadrant D | 45,651,710 | 6,102,719 |
| Mode SS | |||
|---|---|---|---|
| Quadrant | BADHDUFLAG | Total packets | Discarded packets |
| A | 0 | 1542 | 0 |
| B | 0 | 1542 | 0 |
| C | 0 | 1542 | 0 |
| D | 0 | 1542 | 0 |
| Mode M0 | |||
|---|---|---|---|
| Quadrant | BADHDUFLAG | Total packets | Discarded packets |
| A | 0 | 160118 | 0 |
| B | 0 | 169473 | 0 |
| C | 0 | 161570 | 0 |
| D | 0 | 259770 | 0 |
| Mode M9 | |||
|---|---|---|---|
| Quadrant | BADHDUFLAG | Total packets | Discarded packets |
| A | 0 | 118 | 0 |
| B | 0 | 118 | 0 |
| C | 0 | 118 | 0 |
| D | 0 | 118 | 0 |
| Quadrant | Total seconds | Saturated seconds | Saturation percentage |
|---|---|---|---|
| A | 75791 | 897 | 1.183518% |
| B | 75791 | 1361 | 1.795728% |
| C | 75791 | 1463 | 1.930308% |
| D | 75791 | 6721 | 8.867808% |
Noise dominated data is calculated using 1-second bins in cleaned event files. If a bin has >2000 counts, and if more than 50% of those come from <1% of pixels, then it is considered to be noise-dominated and hence unusable.
| Quadrant | # 1 sec bins | Bins with >0 counts | Bins with >2000 counts | High rate bins dominated by noise | Noise dominated (total time) | Noise dominated (detector-on time) | Marked lightcurve |
|---|---|---|---|---|---|---|---|
| A | 87511 | 75784 | 10 | 10 | 0.01% | 0.01% |  |
| B | 87511 | 75782 | 13 | 13 | 0.01% | 0.02% |  |
| C | 87511 | 75787 | 1 | 1 | 0.00% | 0.00% |  |
| D | 87511 | 75788 | 1626 | 1626 | 1.86% | 2.15% |  |
Top three noisy pixels from each quadrant. If the there are fewer than three noisy pixels in the level2.evt file, extra rows are filled as -1
| Pixel properties | Quadrant properties | ||||||
|---|---|---|---|---|---|---|---|
| Quadrant | DetID | PixID | Counts | Sigma | Mean | Median | Sigma |
| A | 15 | 174 | 190491 | 210.45 | 4156 | 4087 | 885.7 |
| A | 13 | 254 | 110725 | 120.39 | 4156 | 4087 | 885.7 |
| A | 13 | 6 | 62034 | 65.42 | 4156 | 4087 | 885.7 |
| B | 10 | 245 | 2609893 | 3325.95 | 4219 | 4119 | 783.5 |
| B | 0 | 230 | 286690 | 360.67 | 4219 | 4119 | 783.5 |
| B | 10 | 246 | 116768 | 143.78 | 4219 | 4119 | 783.5 |
| C | 3 | 233 | 134613 | 136.69 | 4073 | 4061 | 955.1 |
| C | 7 | 220 | 117919 | 119.21 | 4073 | 4061 | 955.1 |
| C | 4 | 224 | 44702 | 42.55 | 4073 | 4061 | 955.1 |
| D | 1 | 52 | 18737015 | 20673.42 | 3985 | 3861 | 906.1 |
| D | 8 | 195 | 10185008 | 11235.65 | 3985 | 3861 | 906.1 |
| D | 2 | 250 | 672118 | 737.47 | 3985 | 3861 | 906.1 |
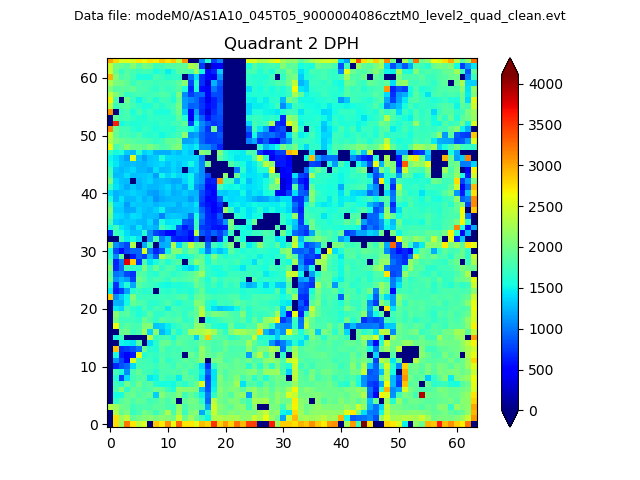
Histogram calculated using DETX and DETY for each event in the final _common_clean file
| Quadrant A |  |
 |
Quadrant B |
|---|---|---|---|
| Quadrant D | 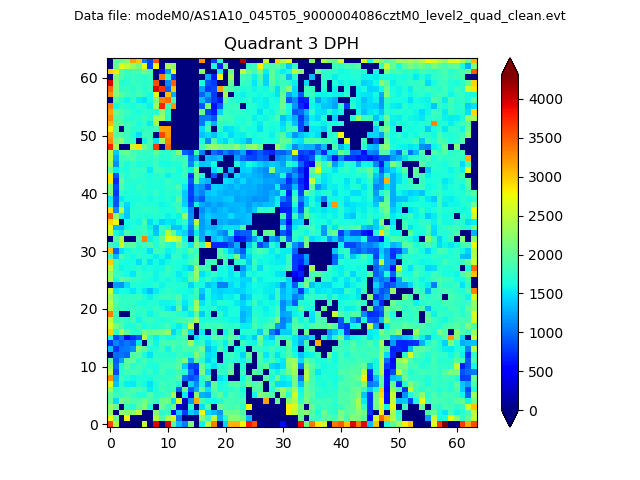 |
 |
Quadrant C |
| Plot type | Count rate plots | Images |
|---|---|---|
| Comparison with Poisson distribution Blue bars denote a histogram of data divided into 1 sec bins. Red curve is a Poisson curve with rate = median count rate of data. |
 |
 |
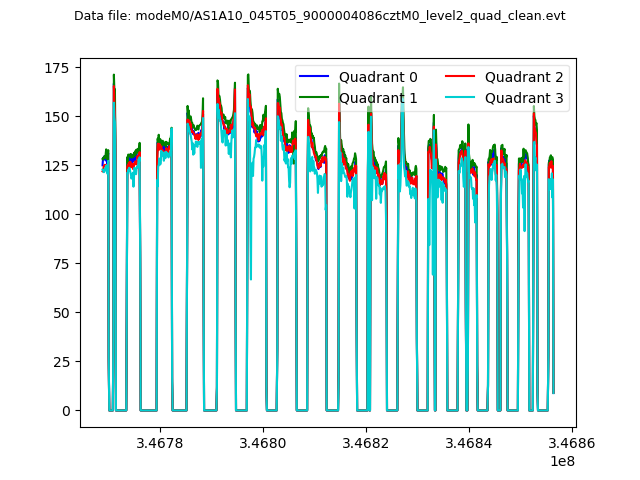
| Quadrant-wise count rates Data is divided into 100 sec bins |
 |
|
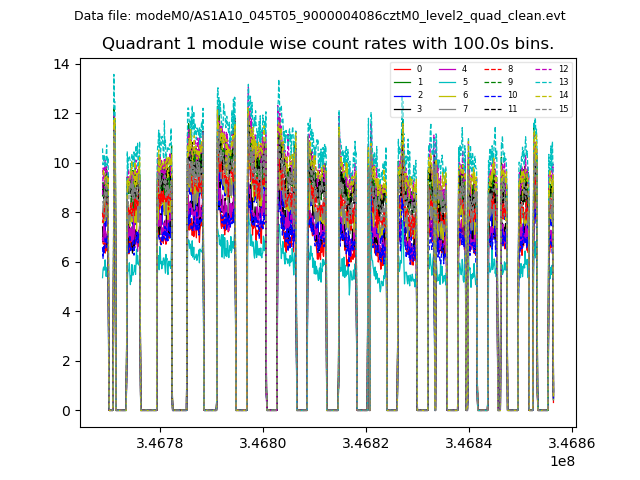
| Module-wise count rates for Quadrant A Data is divided into 100 sec bins |
 |
 |
| Module-wise count rates for Quadrant B Data is divided into 100 sec bins |
 |
 |
| Module-wise count rates for Quadrant C Data is divided into 100 sec bins |
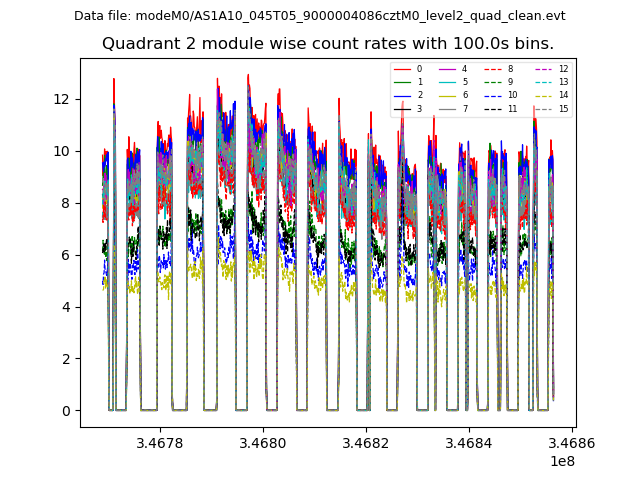 |
 |
| Module-wise count rates for Quadrant D Data is divided into 100 sec bins |
 |
 |
| Parameter | Plot |
|---|---|
| CZT HV Monitor |  |
| D_VDD |  |
| Temperature 1 |  |
| Veto HV Monitor |  |
| Veto LLD | 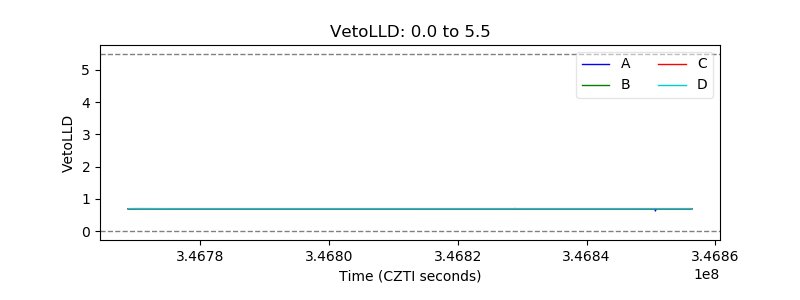 |
| Alpha Counter |  |
| _CPM_Rate |  |
| CZT Counter |  |
| +2.5 Volts monitor |  |
| +5 Volts monitor |  |
| _ROLL_ROT | 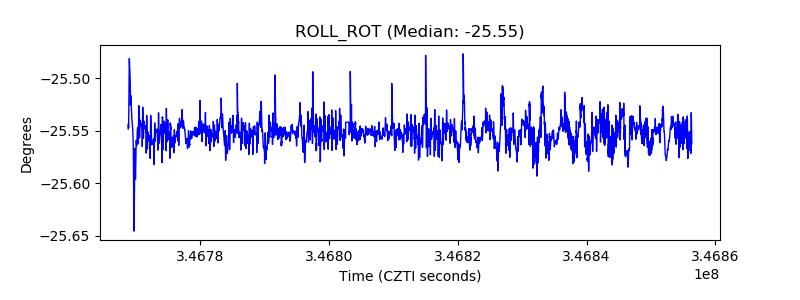 |
| _Roll_DEC |  |
| _Roll_RA |  |
| Veto Counter | 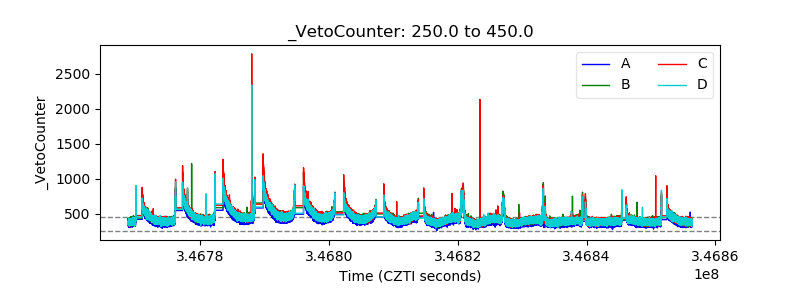 |