| Param | Original file | Final file |
|---|---|---|
| Filename | modeM0/AS1A10_101T02_9000004084cztM0_level2_bc.evt | modeM0/AS1A10_101T02_9000004084cztM0_level2_quad_clean.evt |
| Size (bytes) | 5,447,992,320 | 1,643,155,200 |
| Size | 5.1 GB | 1.5 GB |
| Events in quadrant A | 29,361,905 | 10,483,465 |
| Events in quadrant B | 34,190,731 | 10,661,390 |
| Events in quadrant C | 27,504,484 | 10,094,993 |
| Events in quadrant D | 65,033,346 | 9,562,175 |
| Mode M0 | |||
|---|---|---|---|
| Quadrant | BADHDUFLAG | Total packets | Discarded packets |
| A | 0 | 278211 | 0 |
| B | 0 | 293204 | 0 |
| C | 0 | 276230 | 0 |
| D | 0 | 403240 | 0 |
| Mode SS | |||
|---|---|---|---|
| Quadrant | BADHDUFLAG | Total packets | Discarded packets |
| A | 0 | 2658 | 0 |
| B | 0 | 2658 | 0 |
| C | 0 | 2658 | 0 |
| D | 0 | 2658 | 0 |
| Mode M9 | |||
|---|---|---|---|
| Quadrant | BADHDUFLAG | Total packets | Discarded packets |
| A | 0 | 198 | 0 |
| B | 0 | 198 | 0 |
| C | 0 | 198 | 0 |
| D | 0 | 198 | 0 |
| Quadrant | Total seconds | Saturated seconds | Saturation percentage |
|---|---|---|---|
| A | 130893 | 2415 | 1.845018% |
| B | 130893 | 2844 | 2.172767% |
| C | 130893 | 2891 | 2.208674% |
| D | 130893 | 7526 | 5.749735% |
Noise dominated data is calculated using 1-second bins in cleaned event files. If a bin has >2000 counts, and if more than 50% of those come from <1% of pixels, then it is considered to be noise-dominated and hence unusable.
| Quadrant | # 1 sec bins | Bins with >0 counts | Bins with >2000 counts | High rate bins dominated by noise | Noise dominated (total time) | Noise dominated (detector-on time) | Marked lightcurve |
|---|---|---|---|---|---|---|---|
| A | 150448 | 130889 | 210 | 210 | 0.14% | 0.16% | 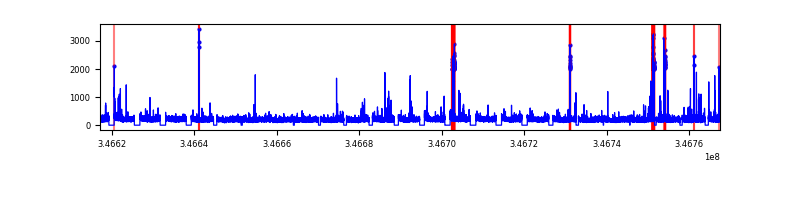 |
| B | 150448 | 130885 | 141 | 141 | 0.09% | 0.11% | 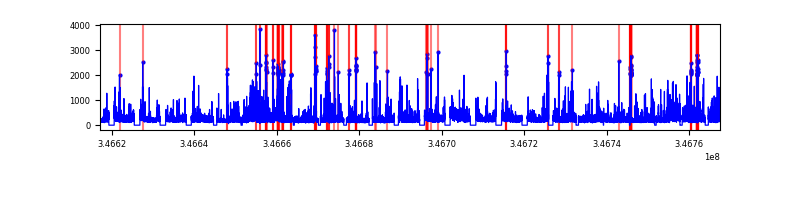 |
| C | 150448 | 130891 | 75 | 75 | 0.05% | 0.06% |  |
| D | 150448 | 130885 | 1397 | 1397 | 0.93% | 1.07% |  |
Top three noisy pixels from each quadrant. If the there are fewer than three noisy pixels in the level2.evt file, extra rows are filled as -1
| Pixel properties | Quadrant properties | ||||||
|---|---|---|---|---|---|---|---|
| Quadrant | DetID | PixID | Counts | Sigma | Mean | Median | Sigma |
| A | 15 | 174 | 1868890 | 1232.89 | 7046 | 6918 | 1510.3 |
| A | 13 | 254 | 213467 | 136.76 | 7046 | 6918 | 1510.3 |
| A | 12 | 96 | 189310 | 120.77 | 7046 | 6918 | 1510.3 |
| B | 10 | 245 | 5210078 | 3881.97 | 7160 | 6991 | 1340.3 |
| B | 10 | 246 | 724465 | 535.3 | 7160 | 6991 | 1340.3 |
| B | 0 | 230 | 477214 | 350.83 | 7160 | 6991 | 1340.3 |
| C | 7 | 220 | 799013 | 493.09 | 6794 | 6762 | 1606.7 |
| C | 3 | 233 | 552731 | 339.81 | 6794 | 6762 | 1606.7 |
| C | 14 | 128 | 44623 | 23.56 | 6794 | 6762 | 1606.7 |
| D | 1 | 52 | 18553844 | 12022.84 | 6759 | 6535 | 1542.7 |
| D | 8 | 195 | 14858384 | 9627.35 | 6759 | 6535 | 1542.7 |
| D | 2 | 250 | 1951315 | 1260.66 | 6759 | 6535 | 1542.7 |
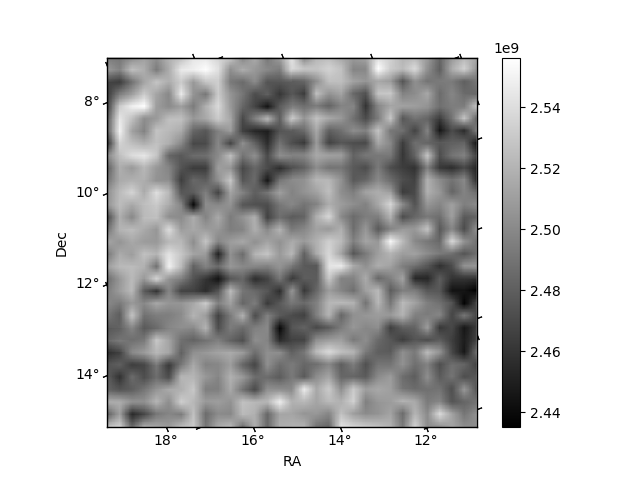
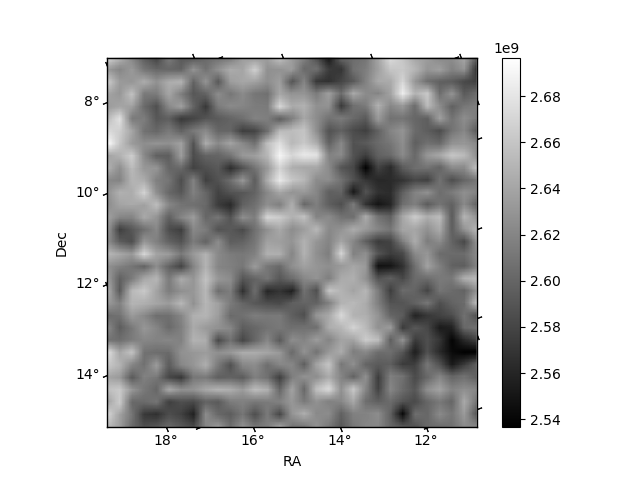
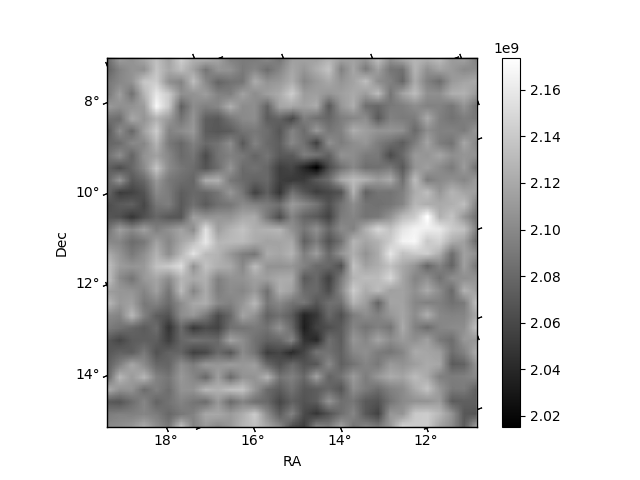
Histogram calculated using DETX and DETY for each event in the final _common_clean file
| Quadrant A |  |
 |
Quadrant B |
|---|---|---|---|
| Quadrant D |  |
 |
Quadrant C |
| Plot type | Count rate plots | Images |
|---|---|---|
| Comparison with Poisson distribution Blue bars denote a histogram of data divided into 1 sec bins. Red curve is a Poisson curve with rate = median count rate of data. |
 |
 |
| Quadrant-wise count rates Data is divided into 100 sec bins |
 |
|
| Module-wise count rates for Quadrant A Data is divided into 100 sec bins |
 |
 |
| Module-wise count rates for Quadrant B Data is divided into 100 sec bins |
 |
 |
| Module-wise count rates for Quadrant C Data is divided into 100 sec bins |
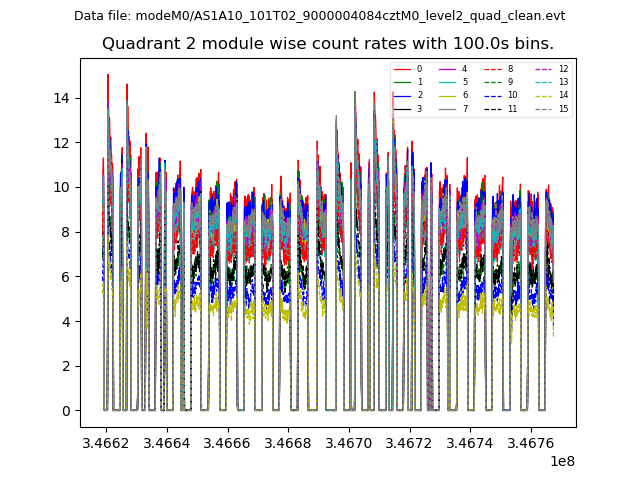 |
 |
| Module-wise count rates for Quadrant D Data is divided into 100 sec bins |
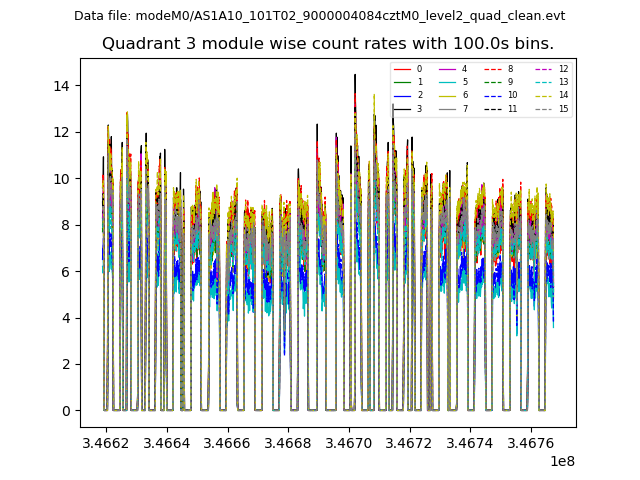 |
 |
| Parameter | Plot |
|---|---|
| CZT HV Monitor | 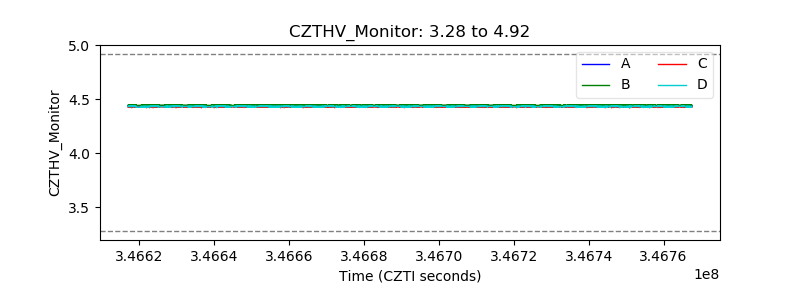 |
| D_VDD |  |
| Temperature 1 |  |
| Veto HV Monitor | 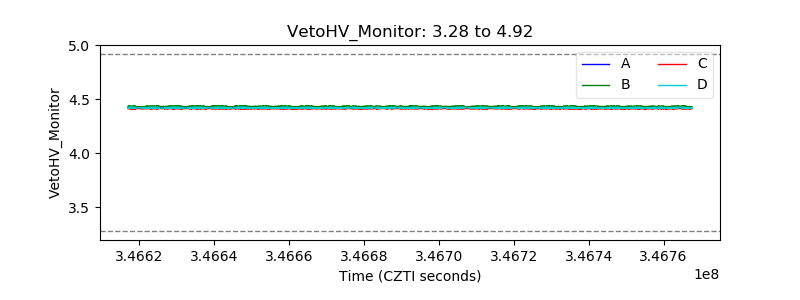 |
| Veto LLD | 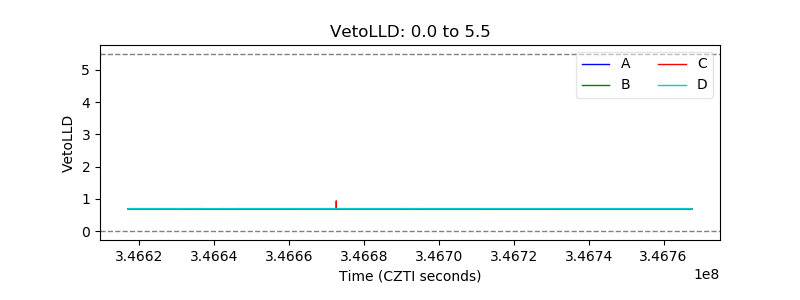 |
| Alpha Counter |  |
| _CPM_Rate |  |
| CZT Counter |  |
| +2.5 Volts monitor |  |
| +5 Volts monitor |  |
| _ROLL_ROT |  |
| _Roll_DEC |  |
| _Roll_RA |  |
| Veto Counter |  |