| Param | Original file | Final file |
|---|---|---|
| Filename | modeM0/AS1A10_116T01_9000004082cztM0_level2_bc.evt | modeM0/AS1A10_116T01_9000004082cztM0_level2_quad_clean.evt |
| Size (bytes) | 6,801,405,120 | 2,141,735,040 |
| Size | 6.3 GB | 2.0 GB |
| Events in quadrant A | 36,914,311 | 13,782,278 |
| Events in quadrant B | 41,606,933 | 14,021,865 |
| Events in quadrant C | 37,662,775 | 13,293,246 |
| Events in quadrant D | 78,576,906 | 12,473,495 |
| Mode SS | |||
|---|---|---|---|
| Quadrant | BADHDUFLAG | Total packets | Discarded packets |
| A | 0 | 3358 | 0 |
| B | 0 | 3358 | 0 |
| C | 0 | 3358 | 0 |
| D | 0 | 3358 | 0 |
| Mode M9 | |||
|---|---|---|---|
| Quadrant | BADHDUFLAG | Total packets | Discarded packets |
| A | 0 | 267 | 0 |
| B | 0 | 267 | 0 |
| C | 0 | 267 | 0 |
| D | 0 | 267 | 0 |
| Mode M0 | |||
|---|---|---|---|
| Quadrant | BADHDUFLAG | Total packets | Discarded packets |
| A | 0 | 351049 | 0 |
| B | 0 | 367867 | 0 |
| C | 0 | 358727 | 0 |
| D | 0 | 493356 | 0 |
| Quadrant | Total seconds | Saturated seconds | Saturation percentage |
|---|---|---|---|
| A | 164957 | 2512 | 1.522821% |
| B | 164957 | 4180 | 2.533994% |
| C | 164957 | 3419 | 2.072661% |
| D | 164957 | 9902 | 6.002776% |
Noise dominated data is calculated using 1-second bins in cleaned event files. If a bin has >2000 counts, and if more than 50% of those come from <1% of pixels, then it is considered to be noise-dominated and hence unusable.
| Quadrant | # 1 sec bins | Bins with >0 counts | Bins with >2000 counts | High rate bins dominated by noise | Noise dominated (total time) | Noise dominated (detector-on time) | Marked lightcurve |
|---|---|---|---|---|---|---|---|
| A | 191572 | 164956 | 73 | 73 | 0.04% | 0.04% |  |
| B | 191572 | 164948 | 202 | 202 | 0.11% | 0.12% | 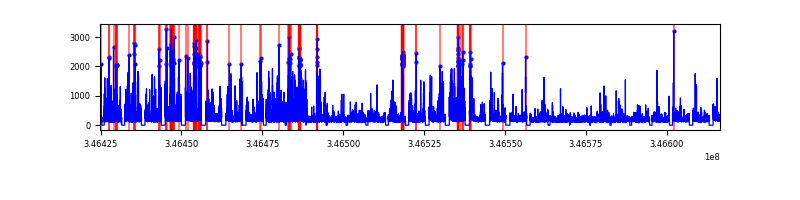 |
| C | 191572 | 164955 | 8 | 8 | 0.00% | 0.00% | 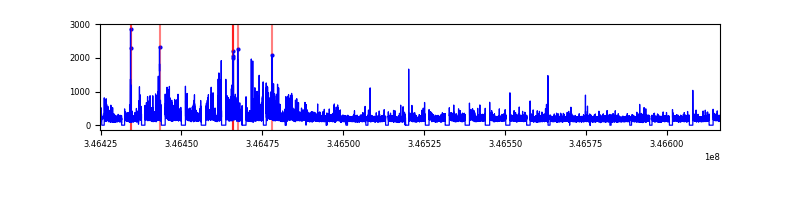 |
| D | 191572 | 164954 | 2198 | 2198 | 1.15% | 1.33% |  |
Top three noisy pixels from each quadrant. If the there are fewer than three noisy pixels in the level2.evt file, extra rows are filled as -1
| Pixel properties | Quadrant properties | ||||||
|---|---|---|---|---|---|---|---|
| Quadrant | DetID | PixID | Counts | Sigma | Mean | Median | Sigma |
| A | 15 | 174 | 2070411 | 1072.99 | 8923 | 8786 | 1921.4 |
| A | 12 | 96 | 266305 | 134.03 | 8923 | 8786 | 1921.4 |
| A | 13 | 254 | 260448 | 130.98 | 8923 | 8786 | 1921.4 |
| B | 10 | 245 | 5333796 | 3151.1 | 9038 | 8825 | 1689.9 |
| B | 10 | 246 | 658095 | 384.21 | 9038 | 8825 | 1689.9 |
| B | 0 | 230 | 466002 | 270.54 | 9038 | 8825 | 1689.9 |
| C | 3 | 233 | 4480875 | 2224.98 | 8598 | 8576 | 2010.0 |
| C | 13 | 61 | 48623 | 19.92 | 8598 | 8576 | 2010.0 |
| C | 7 | 247 | 48227 | 19.73 | 8598 | 8576 | 2010.0 |
| D | 1 | 52 | 27548854 | 14251.92 | 8507 | 8222 | 1932.4 |
| D | 8 | 195 | 13168907 | 6810.48 | 8507 | 8222 | 1932.4 |
| D | 7 | 238 | 2362293 | 1218.2 | 8507 | 8222 | 1932.4 |
Histogram calculated using DETX and DETY for each event in the final _common_clean file
| Quadrant A |  |
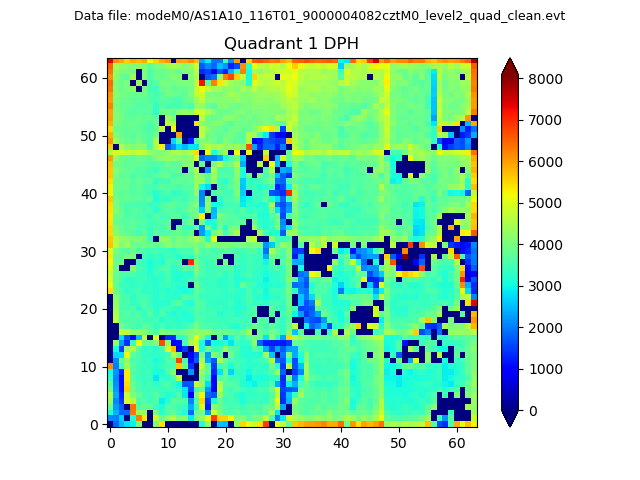 |
Quadrant B |
|---|---|---|---|
| Quadrant D |  |
 |
Quadrant C |
| Plot type | Count rate plots | Images |
|---|---|---|
| Comparison with Poisson distribution Blue bars denote a histogram of data divided into 1 sec bins. Red curve is a Poisson curve with rate = median count rate of data. |
 |
 |
| Quadrant-wise count rates Data is divided into 100 sec bins |
 |
|
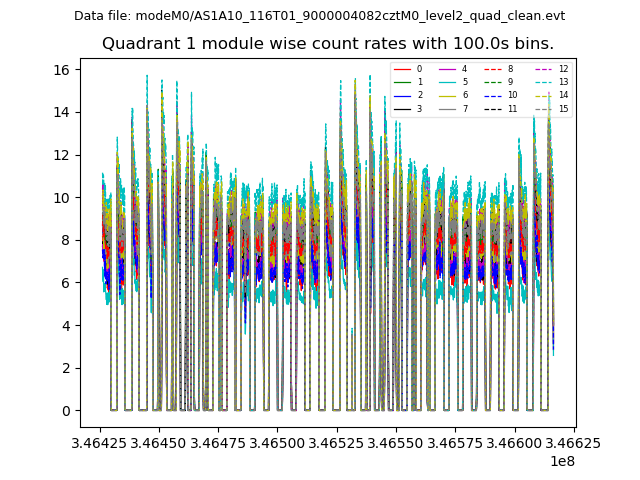
| Module-wise count rates for Quadrant A Data is divided into 100 sec bins |
 |
 |
| Module-wise count rates for Quadrant B Data is divided into 100 sec bins |
 |
 |
| Module-wise count rates for Quadrant C Data is divided into 100 sec bins |
 |
 |
| Module-wise count rates for Quadrant D Data is divided into 100 sec bins |
 |
 |
| Parameter | Plot |
|---|---|
| CZT HV Monitor |  |
| D_VDD |  |
| Temperature 1 |  |
| Veto HV Monitor |  |
| Veto LLD |  |
| Alpha Counter |  |
| _CPM_Rate |  |
| CZT Counter |  |
| +2.5 Volts monitor |  |
| +5 Volts monitor |  |
| _ROLL_ROT |  |
| _Roll_DEC |  |
| _Roll_RA |  |
| Veto Counter |  |