| Param | Original file | Final file |
|---|---|---|
| Filename | modeM0/AS1A10_102T10_9000004080cztM0_level2_bc.evt | modeM0/AS1A10_102T10_9000004080cztM0_level2_quad_clean.evt |
| Size (bytes) | 5,600,033,280 | 1,935,714,240 |
| Size | 5.2 GB | 1.8 GB |
| Events in quadrant A | 29,225,126 | 12,617,681 |
| Events in quadrant B | 34,210,094 | 12,880,763 |
| Events in quadrant C | 27,257,429 | 12,468,278 |
| Events in quadrant D | 69,922,840 | 11,619,603 |
| Mode M0 | |||
|---|---|---|---|
| Quadrant | BADHDUFLAG | Total packets | Discarded packets |
| A | 0 | 279549 | 0 |
| B | 0 | 296464 | 0 |
| C | 0 | 276287 | 0 |
| D | 0 | 420928 | 0 |
| Mode M9 | |||
|---|---|---|---|
| Quadrant | BADHDUFLAG | Total packets | Discarded packets |
| A | 0 | 200 | 0 |
| B | 0 | 200 | 0 |
| C | 0 | 200 | 0 |
| D | 0 | 200 | 0 |
| Mode SS | |||
|---|---|---|---|
| Quadrant | BADHDUFLAG | Total packets | Discarded packets |
| A | 0 | 2682 | 0 |
| B | 0 | 2682 | 0 |
| C | 0 | 2682 | 0 |
| D | 0 | 2682 | 0 |
| Quadrant | Total seconds | Saturated seconds | Saturation percentage |
|---|---|---|---|
| A | 132051 | 1804 | 1.366139% |
| B | 132051 | 3080 | 2.332432% |
| C | 132051 | 2183 | 1.653149% |
| D | 132051 | 11152 | 8.445222% |
Noise dominated data is calculated using 1-second bins in cleaned event files. If a bin has >2000 counts, and if more than 50% of those come from <1% of pixels, then it is considered to be noise-dominated and hence unusable.
| Quadrant | # 1 sec bins | Bins with >0 counts | Bins with >2000 counts | High rate bins dominated by noise | Noise dominated (total time) | Noise dominated (detector-on time) | Marked lightcurve |
|---|---|---|---|---|---|---|---|
| A | 151791 | 132055 | 20 | 20 | 0.01% | 0.02% |  |
| B | 151791 | 132047 | 249 | 249 | 0.16% | 0.19% |  |
| C | 151791 | 132048 | 0 | 0 | 0.00% | 0.00% |  |
| D | 151791 | 132038 | 3233 | 3233 | 2.13% | 2.45% |  |
Top three noisy pixels from each quadrant. If the there are fewer than three noisy pixels in the level2.evt file, extra rows are filled as -1
| Pixel properties | Quadrant properties | ||||||
|---|---|---|---|---|---|---|---|
| Quadrant | DetID | PixID | Counts | Sigma | Mean | Median | Sigma |
| A | 15 | 174 | 1449898 | 945.11 | 7130 | 7017 | 1526.7 |
| A | 13 | 254 | 213930 | 135.53 | 7130 | 7017 | 1526.7 |
| A | 8 | 192 | 108570 | 66.52 | 7130 | 7017 | 1526.7 |
| B | 10 | 245 | 4535364 | 3332.86 | 7220 | 7050 | 1358.7 |
| B | 10 | 246 | 906793 | 662.21 | 7220 | 7050 | 1358.7 |
| B | 4 | 200 | 402508 | 291.06 | 7220 | 7050 | 1358.7 |
| C | 3 | 233 | 551385 | 332.79 | 6937 | 6922 | 1636.0 |
| C | 13 | 61 | 39919 | 20.17 | 6937 | 6922 | 1636.0 |
| C | 7 | 247 | 26770 | 12.13 | 6937 | 6922 | 1636.0 |
| D | 1 | 52 | 26924680 | 17473.04 | 6763 | 6557 | 1540.6 |
| D | 8 | 195 | 9386525 | 6088.71 | 6763 | 6557 | 1540.6 |
| D | 2 | 250 | 2442025 | 1580.91 | 6763 | 6557 | 1540.6 |
Histogram calculated using DETX and DETY for each event in the final _common_clean file
| Quadrant A |  |
 |
Quadrant B |
|---|---|---|---|
| Quadrant D |  |
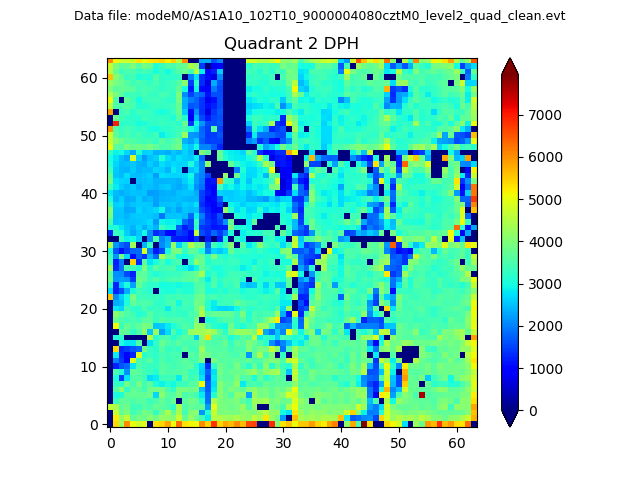 |
Quadrant C |
| Plot type | Count rate plots | Images |
|---|---|---|
| Comparison with Poisson distribution Blue bars denote a histogram of data divided into 1 sec bins. Red curve is a Poisson curve with rate = median count rate of data. |
 |
 |
| Quadrant-wise count rates Data is divided into 100 sec bins |
 |
|
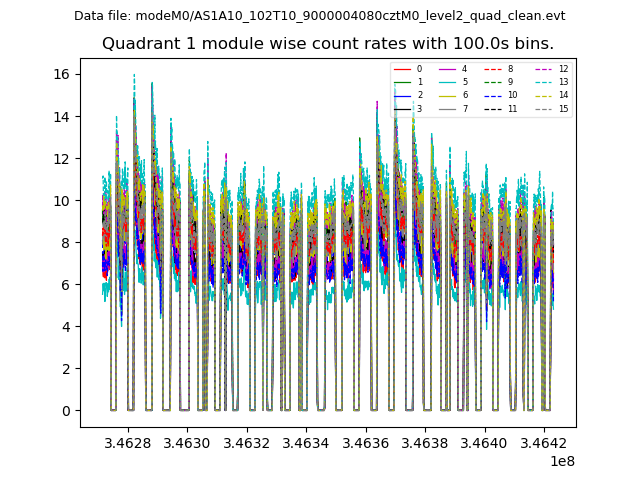
| Module-wise count rates for Quadrant A Data is divided into 100 sec bins |
 |
 |
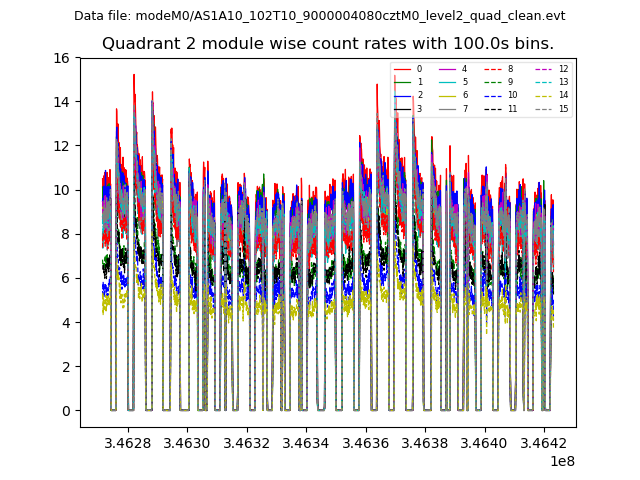
| Module-wise count rates for Quadrant B Data is divided into 100 sec bins |
 |
 |
| Module-wise count rates for Quadrant C Data is divided into 100 sec bins |
 |
 |
| Module-wise count rates for Quadrant D Data is divided into 100 sec bins |
 |
 |
| Parameter | Plot |
|---|---|
| CZT HV Monitor |  |
| D_VDD |  |
| Temperature 1 |  |
| Veto HV Monitor | 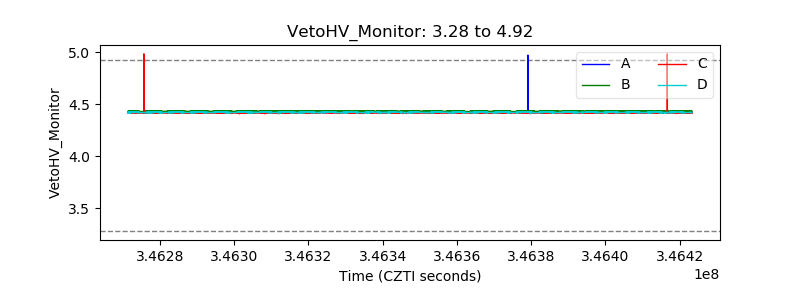 |
| Veto LLD |  |
| Alpha Counter | 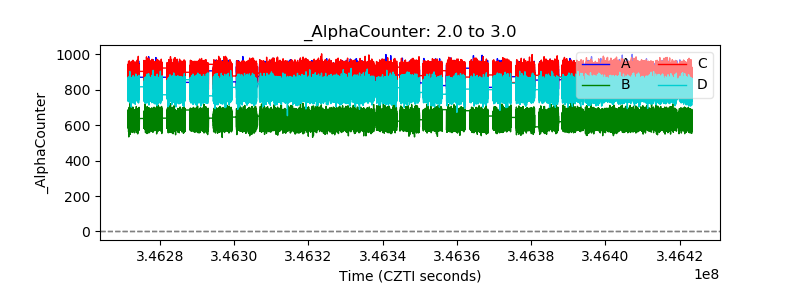 |
| _CPM_Rate | 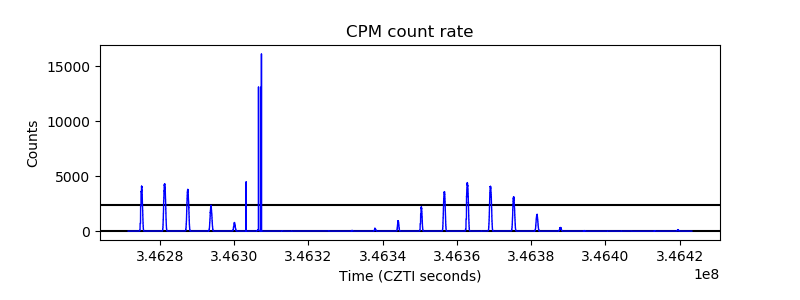 |
| CZT Counter | 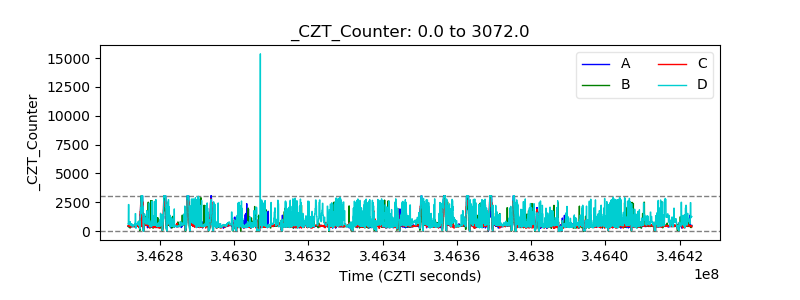 |
| +2.5 Volts monitor | 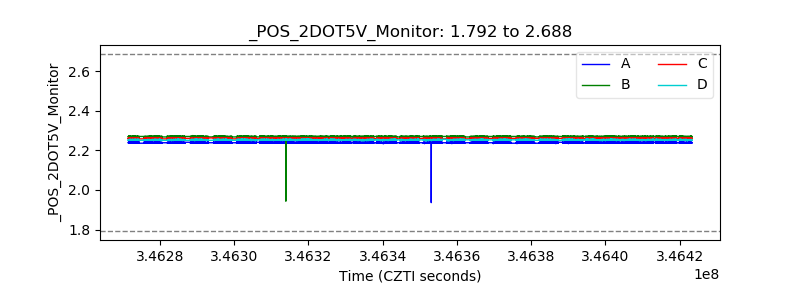 |
| +5 Volts monitor | 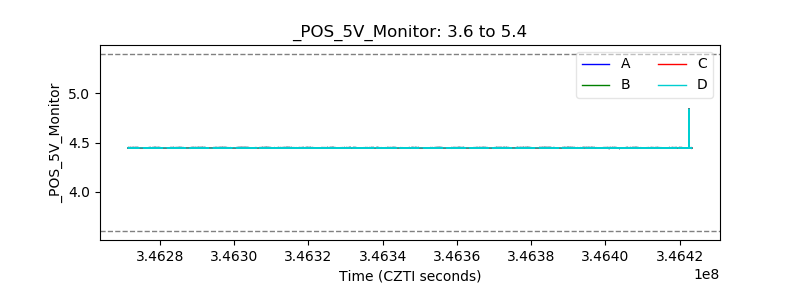 |
| _ROLL_ROT |  |
| _Roll_DEC | 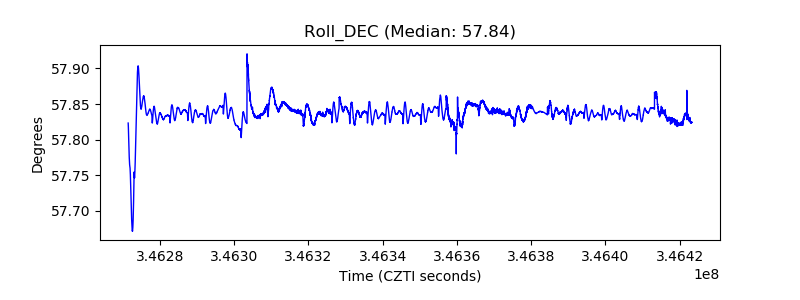 |
| _Roll_RA |  |
| Veto Counter |  |