| Param | Original file | Final file |
|---|---|---|
| Filename | modeM0/AS1A10_102T06_9000004078cztM0_level2_bc.evt | modeM0/AS1A10_102T06_9000004078cztM0_level2_quad_clean.evt |
| Size (bytes) | 4,082,785,920 | 1,425,447,360 |
| Size | 3.8 GB | 1.3 GB |
| Events in quadrant A | 20,399,405 | 9,401,984 |
| Events in quadrant B | 29,444,778 | 9,426,401 |
| Events in quadrant C | 19,287,937 | 9,248,263 |
| Events in quadrant D | 48,112,826 | 8,651,413 |
| Mode SS | |||
|---|---|---|---|
| Quadrant | BADHDUFLAG | Total packets | Discarded packets |
| A | 0 | 1920 | 0 |
| B | 0 | 1920 | 0 |
| C | 0 | 1576 | 0 |
| D | 0 | 1920 | 0 |
| Mode M9 | |||
|---|---|---|---|
| Quadrant | BADHDUFLAG | Total packets | Discarded packets |
| A | 0 | 150 | 0 |
| B | 0 | 150 | 0 |
| C | 0 | 150 | 0 |
| D | 0 | 150 | 0 |
| Mode M0 | |||
|---|---|---|---|
| Quadrant | BADHDUFLAG | Total packets | Discarded packets |
| A | 0 | 197823 | 0 |
| B | 0 | 228205 | 0 |
| C | 0 | 197070 | 0 |
| D | 0 | 294791 | 0 |
| Quadrant | Total seconds | Saturated seconds | Saturation percentage |
|---|---|---|---|
| A | 94336 | 1320 | 1.399254% |
| B | 94336 | 4787 | 5.074415% |
| C | 94336 | 1555 | 1.648363% |
| D | 94336 | 8021 | 8.502586% |
Noise dominated data is calculated using 1-second bins in cleaned event files. If a bin has >2000 counts, and if more than 50% of those come from <1% of pixels, then it is considered to be noise-dominated and hence unusable.
| Quadrant | # 1 sec bins | Bins with >0 counts | Bins with >2000 counts | High rate bins dominated by noise | Noise dominated (total time) | Noise dominated (detector-on time) | Marked lightcurve |
|---|---|---|---|---|---|---|---|
| A | 109401 | 94328 | 22 | 22 | 0.02% | 0.02% |  |
| B | 109401 | 94330 | 1530 | 1530 | 1.40% | 1.62% |  |
| C | 109401 | 94328 | 5 | 5 | 0.00% | 0.01% |  |
| D | 109401 | 94327 | 2413 | 2413 | 2.21% | 2.56% |  |
Top three noisy pixels from each quadrant. If the there are fewer than three noisy pixels in the level2.evt file, extra rows are filled as -1
| Pixel properties | Quadrant properties | ||||||
|---|---|---|---|---|---|---|---|
| Quadrant | DetID | PixID | Counts | Sigma | Mean | Median | Sigma |
| A | 15 | 174 | 765018 | 701.23 | 5012 | 4936 | 1083.9 |
| A | 13 | 254 | 156745 | 140.05 | 5012 | 4936 | 1083.9 |
| A | 12 | 96 | 142679 | 127.08 | 5012 | 4936 | 1083.9 |
| B | 10 | 245 | 9563667 | 10121.55 | 5009 | 4899 | 944.4 |
| B | 4 | 200 | 224891 | 232.94 | 5009 | 4899 | 944.4 |
| B | 0 | 230 | 192777 | 198.94 | 5009 | 4899 | 944.4 |
| C | 3 | 233 | 527545 | 452.96 | 4858 | 4843 | 1154.0 |
| C | 15 | 208 | 94043 | 77.3 | 4858 | 4843 | 1154.0 |
| C | 13 | 61 | 27665 | 19.78 | 4858 | 4843 | 1154.0 |
| D | 1 | 52 | 19989017 | 18221.04 | 4749 | 4599 | 1096.8 |
| D | 8 | 195 | 5725027 | 5215.67 | 4749 | 4599 | 1096.8 |
| D | 12 | 250 | 1773849 | 1613.14 | 4749 | 4599 | 1096.8 |
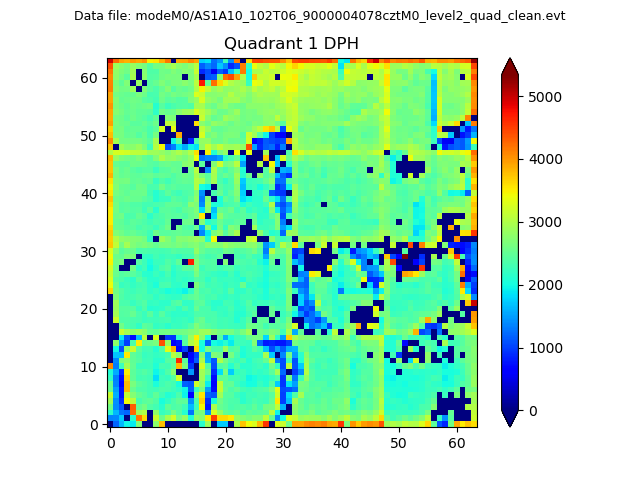
Histogram calculated using DETX and DETY for each event in the final _common_clean file
| Quadrant A |  |
 |
Quadrant B |
|---|---|---|---|
| Quadrant D |  |
 |
Quadrant C |
| Plot type | Count rate plots | Images |
|---|---|---|
| Comparison with Poisson distribution Blue bars denote a histogram of data divided into 1 sec bins. Red curve is a Poisson curve with rate = median count rate of data. |
 |
 |
| Quadrant-wise count rates Data is divided into 100 sec bins |
 |
|
| Module-wise count rates for Quadrant A Data is divided into 100 sec bins |
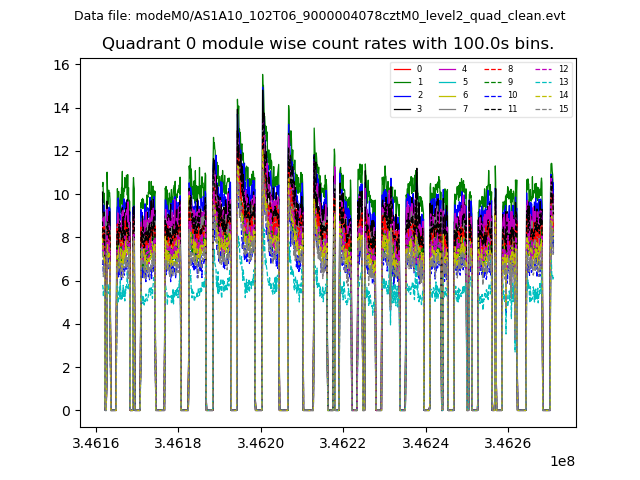 |
 |
| Module-wise count rates for Quadrant B Data is divided into 100 sec bins |
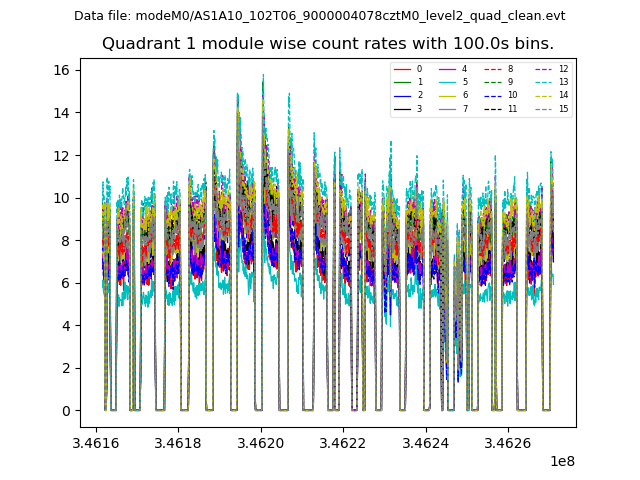 |
 |
| Module-wise count rates for Quadrant C Data is divided into 100 sec bins |
 |
 |
| Module-wise count rates for Quadrant D Data is divided into 100 sec bins |
 |
 |
| Parameter | Plot |
|---|---|
| CZT HV Monitor | 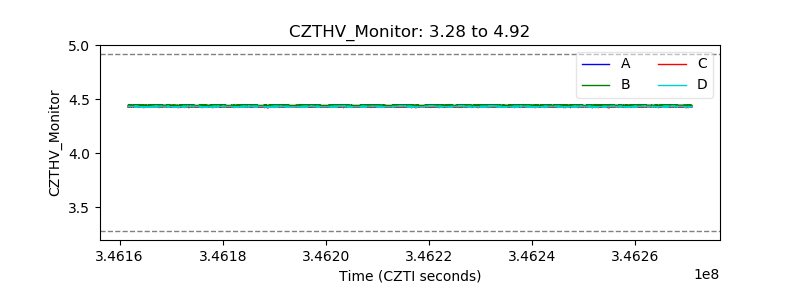 |
| D_VDD |  |
| Temperature 1 |  |
| Veto HV Monitor | 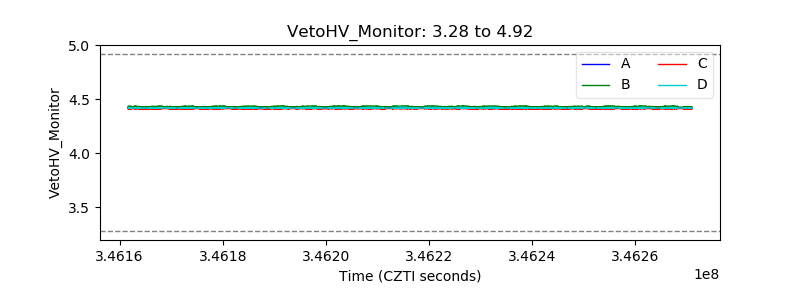 |
| Veto LLD | 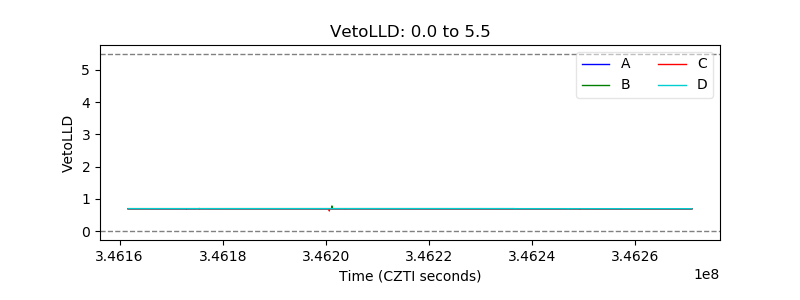 |
| Alpha Counter |  |
| _CPM_Rate | 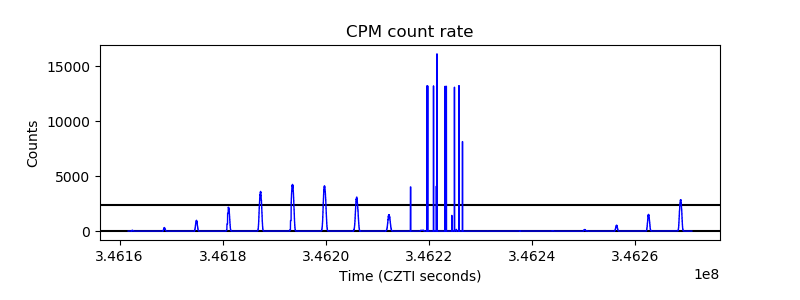 |
| CZT Counter |  |
| +2.5 Volts monitor |  |
| +5 Volts monitor |  |
| _ROLL_ROT | 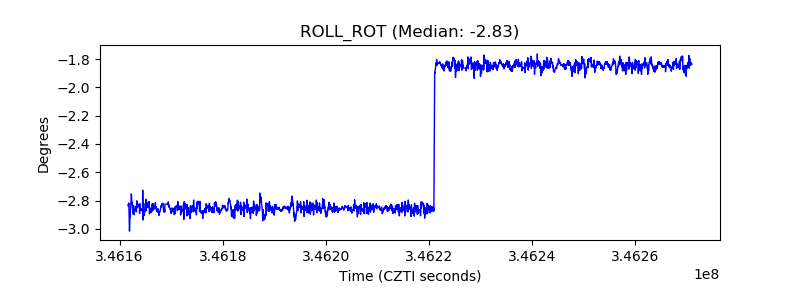 |
| _Roll_DEC |  |
| _Roll_RA | 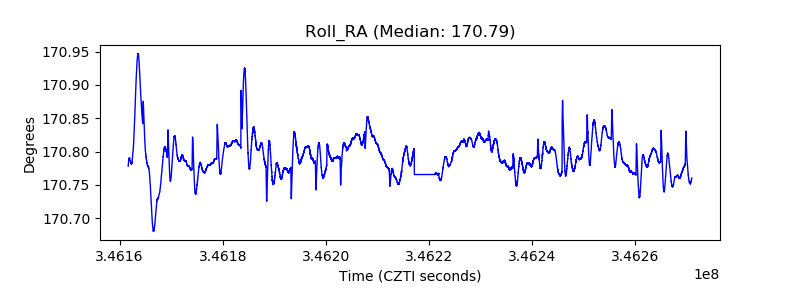 |
| Veto Counter |  |