| Param | Original file | Final file |
|---|---|---|
| Filename | modeM0/AS1A10_067T01_9000004076cztM0_level2_bc.evt | modeM0/AS1A10_067T01_9000004076cztM0_level2_quad_clean.evt |
| Size (bytes) | 769,654,080 | 221,022,720 |
| Size | 734.0 MB | 210.8 MB |
| Events in quadrant A | 3,823,972 | 1,405,126 |
| Events in quadrant B | 3,826,738 | 1,418,527 |
| Events in quadrant C | 3,700,586 | 1,349,862 |
| Events in quadrant D | 10,719,133 | 1,276,262 |
| Mode M0 | |||
|---|---|---|---|
| Quadrant | BADHDUFLAG | Total packets | Discarded packets |
| A | 0 | 37435 | 0 |
| B | 0 | 37449 | 0 |
| C | 0 | 37494 | 0 |
| D | 0 | 62270 | 0 |
| Mode SS | |||
|---|---|---|---|
| Quadrant | BADHDUFLAG | Total packets | Discarded packets |
| A | 0 | 374 | 0 |
| B | 0 | 374 | 0 |
| C | 0 | 374 | 0 |
| D | 0 | 374 | 0 |
| Mode M9 | |||
|---|---|---|---|
| Quadrant | BADHDUFLAG | Total packets | Discarded packets |
| A | 0 | 31 | 0 |
| B | 0 | 28 | 0 |
| C | 0 | 31 | 0 |
| D | 0 | 30 | 0 |
| Quadrant | Total seconds | Saturated seconds | Saturation percentage |
|---|---|---|---|
| A | 18040 | 319 | 1.768293% |
| B | 18040 | 324 | 1.796009% |
| C | 18035 | 373 | 2.068201% |
| D | 18023 | 2215 | 12.289852% |
Noise dominated data is calculated using 1-second bins in cleaned event files. If a bin has >2000 counts, and if more than 50% of those come from <1% of pixels, then it is considered to be noise-dominated and hence unusable.
| Quadrant | # 1 sec bins | Bins with >0 counts | Bins with >2000 counts | High rate bins dominated by noise | Noise dominated (total time) | Noise dominated (detector-on time) | Marked lightcurve |
|---|---|---|---|---|---|---|---|
| A | 18326 | 16310 | 0 | 0 | 0.00% | 0.00% |  |
| B | 18326 | 16309 | 2 | 2 | 0.01% | 0.01% |  |
| C | 18326 | 16310 | 0 | 0 | 0.00% | 0.00% | 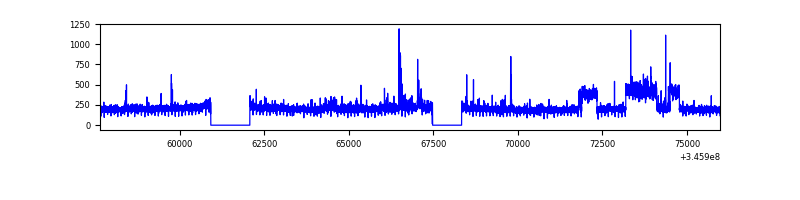 |
| D | 18326 | 16310 | 817 | 817 | 4.46% | 5.01% |  |
Top three noisy pixels from each quadrant. If the there are fewer than three noisy pixels in the level2.evt file, extra rows are filled as -1
| Pixel properties | Quadrant properties | ||||||
|---|---|---|---|---|---|---|---|
| Quadrant | DetID | PixID | Counts | Sigma | Mean | Median | Sigma |
| A | 12 | 96 | 72568 | 342.18 | 970 | 953 | 209.3 |
| A | 13 | 254 | 24048 | 110.35 | 970 | 953 | 209.3 |
| A | 0 | 226 | 5970 | 23.97 | 970 | 953 | 209.3 |
| B | 0 | 230 | 28835 | 151.31 | 971 | 947 | 184.3 |
| B | 0 | 183 | 27047 | 141.61 | 971 | 947 | 184.3 |
| B | 4 | 200 | 14192 | 71.86 | 971 | 947 | 184.3 |
| C | 3 | 233 | 65206 | 295.51 | 924 | 918 | 217.6 |
| C | 2 | 16 | 45646 | 205.6 | 924 | 918 | 217.6 |
| C | 7 | 220 | 24640 | 109.04 | 924 | 918 | 217.6 |
| D | 1 | 52 | 4846064 | 23447.35 | 902 | 873 | 206.6 |
| D | 5 | 222 | 1245042 | 6020.91 | 902 | 873 | 206.6 |
| D | 8 | 195 | 647449 | 3128.98 | 902 | 873 | 206.6 |
Histogram calculated using DETX and DETY for each event in the final _common_clean file
| Quadrant A | 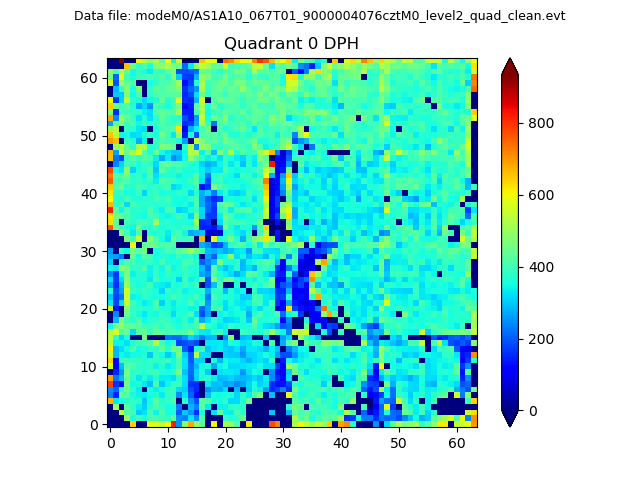 |
 |
Quadrant B |
|---|---|---|---|
| Quadrant D |  |
 |
Quadrant C |
| Plot type | Count rate plots | Images |
|---|---|---|
| Comparison with Poisson distribution Blue bars denote a histogram of data divided into 1 sec bins. Red curve is a Poisson curve with rate = median count rate of data. |
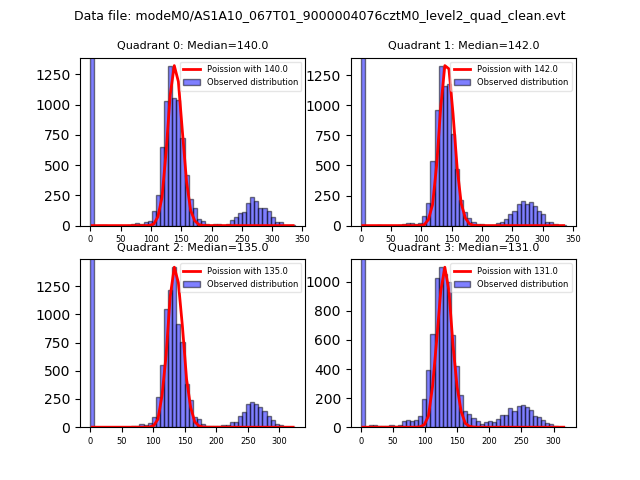 |
 |
| Quadrant-wise count rates Data is divided into 100 sec bins |
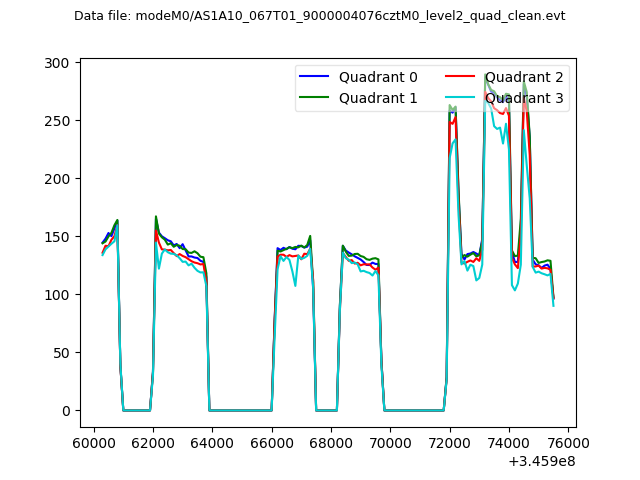 |
|
| Module-wise count rates for Quadrant A Data is divided into 100 sec bins |
 |
 |
| Module-wise count rates for Quadrant B Data is divided into 100 sec bins |
 |
 |
| Module-wise count rates for Quadrant C Data is divided into 100 sec bins |
 |
 |
| Module-wise count rates for Quadrant D Data is divided into 100 sec bins |
 |
 |
| Parameter | Plot |
|---|---|
| CZT HV Monitor |  |
| D_VDD | 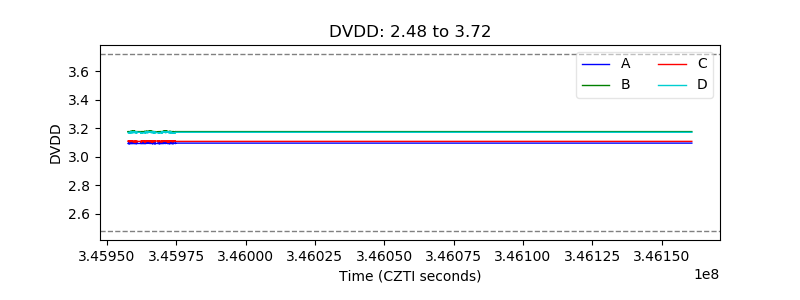 |
| Temperature 1 |  |
| Veto HV Monitor |  |
| Veto LLD |  |
| Alpha Counter |  |
| _CPM_Rate |  |
| CZT Counter |  |
| +2.5 Volts monitor |  |
| +5 Volts monitor |  |
| _ROLL_ROT | 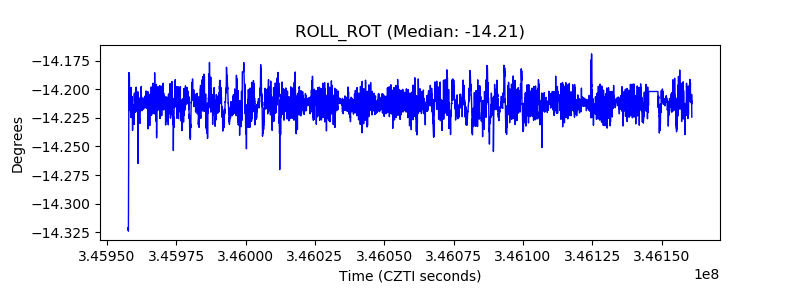 |
| _Roll_DEC | 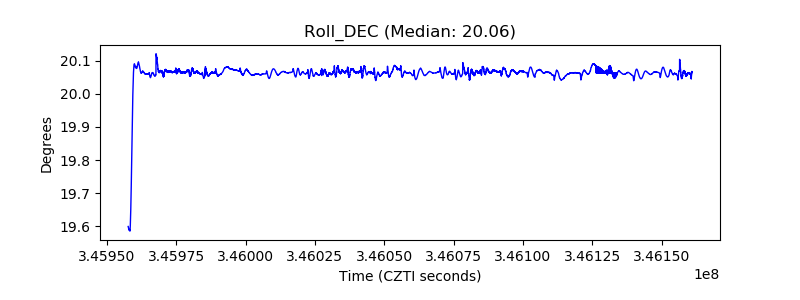 |
| _Roll_RA |  |
| Veto Counter |  |