| Param | Original file | Final file |
|---|---|---|
| Filename | modeM0/AS1A10_045T09_9000004072cztM0_level2_bc.evt | modeM0/AS1A10_045T09_9000004072cztM0_level2_quad_clean.evt |
| Size (bytes) | 5,472,213,120 | 1,804,400,640 |
| Size | 5.1 GB | 1.7 GB |
| Events in quadrant A | 29,432,480 | 11,572,803 |
| Events in quadrant B | 30,612,563 | 11,806,875 |
| Events in quadrant C | 29,196,977 | 11,208,836 |
| Events in quadrant D | 67,222,216 | 10,738,564 |
| Mode M0 | |||
|---|---|---|---|
| Quadrant | BADHDUFLAG | Total packets | Discarded packets |
| A | 0 | 285566 | 0 |
| B | 0 | 290301 | 0 |
| C | 0 | 289106 | 0 |
| D | 0 | 409740 | 0 |
| Mode M9 | |||
|---|---|---|---|
| Quadrant | BADHDUFLAG | Total packets | Discarded packets |
| A | 0 | 204 | 0 |
| B | 0 | 204 | 0 |
| C | 0 | 204 | 0 |
| D | 0 | 204 | 0 |
| Mode SS | |||
|---|---|---|---|
| Quadrant | BADHDUFLAG | Total packets | Discarded packets |
| A | 0 | 2778 | 0 |
| B | 0 | 2776 | 0 |
| C | 0 | 2774 | 0 |
| D | 0 | 2776 | 0 |
| Quadrant | Total seconds | Saturated seconds | Saturation percentage |
|---|---|---|---|
| A | 136137 | 1502 | 1.103300% |
| B | 136125 | 2191 | 1.609550% |
| C | 136129 | 2600 | 1.909953% |
| D | 136116 | 7557 | 5.551882% |
Noise dominated data is calculated using 1-second bins in cleaned event files. If a bin has >2000 counts, and if more than 50% of those come from <1% of pixels, then it is considered to be noise-dominated and hence unusable.
| Quadrant | # 1 sec bins | Bins with >0 counts | Bins with >2000 counts | High rate bins dominated by noise | Noise dominated (total time) | Noise dominated (detector-on time) | Marked lightcurve |
|---|---|---|---|---|---|---|---|
| A | 156945 | 136236 | 4 | 4 | 0.00% | 0.00% | 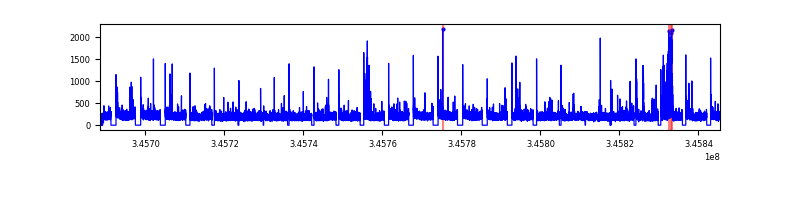 |
| B | 156945 | 136218 | 43 | 43 | 0.03% | 0.03% |  |
| C | 156945 | 136211 | 16 | 16 | 0.01% | 0.01% |  |
| D | 156945 | 136216 | 2133 | 2133 | 1.36% | 1.57% |  |
Top three noisy pixels from each quadrant. If the there are fewer than three noisy pixels in the level2.evt file, extra rows are filled as -1
| Pixel properties | Quadrant properties | ||||||
|---|---|---|---|---|---|---|---|
| Quadrant | DetID | PixID | Counts | Sigma | Mean | Median | Sigma |
| A | 12 | 16 | 972075 | 615.81 | 7256 | 7133 | 1566.9 |
| A | 12 | 194 | 194341 | 119.47 | 7256 | 7133 | 1566.9 |
| A | 13 | 254 | 187972 | 115.41 | 7256 | 7133 | 1566.9 |
| B | 10 | 245 | 1821101 | 1317.74 | 7325 | 7141 | 1376.6 |
| B | 0 | 230 | 260445 | 184.01 | 7325 | 7141 | 1376.6 |
| B | 0 | 183 | 213793 | 150.12 | 7325 | 7141 | 1376.6 |
| C | 3 | 233 | 1448718 | 881.58 | 6969 | 6934 | 1635.5 |
| C | 15 | 208 | 403351 | 242.39 | 6969 | 6934 | 1635.5 |
| C | 9 | 221 | 163287 | 95.6 | 6969 | 6934 | 1635.5 |
| D | 1 | 52 | 31250862 | 19535.99 | 6957 | 6730 | 1599.3 |
| D | 8 | 195 | 2985262 | 1862.38 | 6957 | 6730 | 1599.3 |
| D | 5 | 222 | 2202953 | 1373.23 | 6957 | 6730 | 1599.3 |
Histogram calculated using DETX and DETY for each event in the final _common_clean file
| Quadrant A |  |
 |
Quadrant B |
|---|---|---|---|
| Quadrant D |  |
 |
Quadrant C |
| Plot type | Count rate plots | Images |
|---|---|---|
| Comparison with Poisson distribution Blue bars denote a histogram of data divided into 1 sec bins. Red curve is a Poisson curve with rate = median count rate of data. |
 |
 |
| Quadrant-wise count rates Data is divided into 100 sec bins |
 |
|
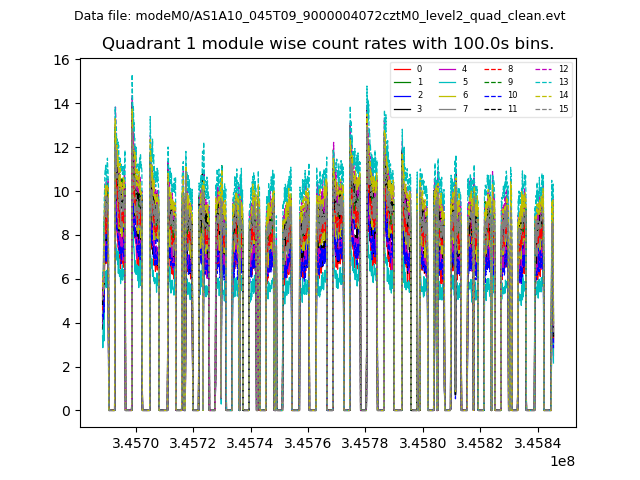
| Module-wise count rates for Quadrant A Data is divided into 100 sec bins |
 |
 |
| Module-wise count rates for Quadrant B Data is divided into 100 sec bins |
 |
 |
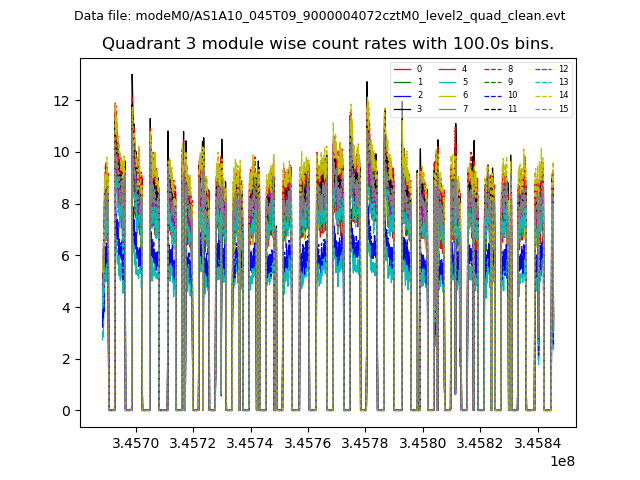
| Module-wise count rates for Quadrant C Data is divided into 100 sec bins |
 |
 |
| Module-wise count rates for Quadrant D Data is divided into 100 sec bins |
 |
 |
| Parameter | Plot |
|---|---|
| CZT HV Monitor |  |
| D_VDD |  |
| Temperature 1 |  |
| Veto HV Monitor |  |
| Veto LLD |  |
| Alpha Counter |  |
| _CPM_Rate |  |
| CZT Counter |  |
| +2.5 Volts monitor |  |
| +5 Volts monitor |  |
| _ROLL_ROT |  |
| _Roll_DEC |  |
| _Roll_RA |  |
| Veto Counter |  |