| Param | Original file | Final file |
|---|---|---|
| Filename | modeM0/AS1A10_090T16_9000004070cztM0_level2_bc.evt | modeM0/AS1A10_090T16_9000004070cztM0_level2_quad_clean.evt |
| Size (bytes) | 1,844,029,440 | 572,063,040 |
| Size | 1.7 GB | 545.6 MB |
| Events in quadrant A | 8,841,455 | 3,800,201 |
| Events in quadrant B | 9,060,230 | 3,838,740 |
| Events in quadrant C | 8,935,146 | 3,661,075 |
| Events in quadrant D | 26,151,672 | 3,148,843 |
| Mode SS | |||
|---|---|---|---|
| Quadrant | BADHDUFLAG | Total packets | Discarded packets |
| A | 0 | 858 | 0 |
| B | 0 | 858 | 0 |
| C | 0 | 858 | 0 |
| D | 0 | 858 | 0 |
| Mode M0 | |||
|---|---|---|---|
| Quadrant | BADHDUFLAG | Total packets | Discarded packets |
| A | 0 | 86958 | 0 |
| B | 0 | 88227 | 0 |
| C | 0 | 88996 | 0 |
| D | 0 | 160129 | 0 |
| Mode M9 | |||
|---|---|---|---|
| Quadrant | BADHDUFLAG | Total packets | Discarded packets |
| A | 0 | 55 | 0 |
| B | 0 | 55 | 0 |
| C | 0 | 55 | 0 |
| D | 0 | 55 | 0 |
| Quadrant | Total seconds | Saturated seconds | Saturation percentage |
|---|---|---|---|
| A | 41871 | 468 | 1.117719% |
| B | 41876 | 614 | 1.466234% |
| C | 41872 | 853 | 2.037161% |
| D | 41865 | 7558 | 18.053266% |
Noise dominated data is calculated using 1-second bins in cleaned event files. If a bin has >2000 counts, and if more than 50% of those come from <1% of pixels, then it is considered to be noise-dominated and hence unusable.
| Quadrant | # 1 sec bins | Bins with >0 counts | Bins with >2000 counts | High rate bins dominated by noise | Noise dominated (total time) | Noise dominated (detector-on time) | Marked lightcurve |
|---|---|---|---|---|---|---|---|
| A | 47732 | 41888 | 0 | 0 | 0.00% | 0.00% |  |
| B | 47732 | 41893 | 20 | 20 | 0.04% | 0.05% | 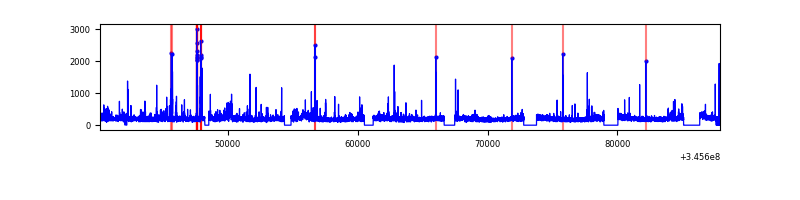 |
| C | 47732 | 41887 | 2 | 2 | 0.00% | 0.00% |  |
| D | 47731 | 41868 | 1403 | 1403 | 2.94% | 3.35% | 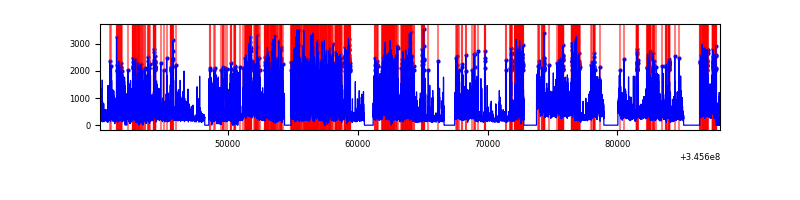 |
Top three noisy pixels from each quadrant. If the there are fewer than three noisy pixels in the level2.evt file, extra rows are filled as -1
| Pixel properties | Quadrant properties | ||||||
|---|---|---|---|---|---|---|---|
| Quadrant | DetID | PixID | Counts | Sigma | Mean | Median | Sigma |
| A | 12 | 16 | 349071 | 734.13 | 2158 | 2117 | 472.6 |
| A | 12 | 194 | 66264 | 135.73 | 2158 | 2117 | 472.6 |
| A | 5 | 98 | 65850 | 134.85 | 2158 | 2117 | 472.6 |
| B | 10 | 246 | 232724 | 555.45 | 2169 | 2114 | 415.2 |
| B | 15 | 32 | 176613 | 420.3 | 2169 | 2114 | 415.2 |
| B | 0 | 230 | 94732 | 223.08 | 2169 | 2114 | 415.2 |
| C | 3 | 233 | 833178 | 1692.39 | 2074 | 2065 | 491.1 |
| C | 15 | 208 | 92429 | 184.01 | 2074 | 2065 | 491.1 |
| C | 8 | 128 | 14172 | 24.65 | 2074 | 2065 | 491.1 |
| D | 1 | 52 | 14169424 | 31574.85 | 1904 | 1842 | 448.7 |
| D | 5 | 222 | 1743181 | 3880.87 | 1904 | 1842 | 448.7 |
| D | 7 | 80 | 1028168 | 2287.34 | 1904 | 1842 | 448.7 |
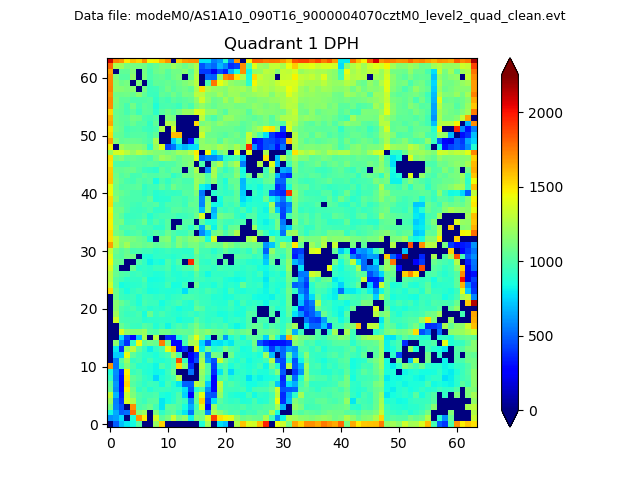
Histogram calculated using DETX and DETY for each event in the final _common_clean file
| Quadrant A |  |
 |
Quadrant B |
|---|---|---|---|
| Quadrant D | 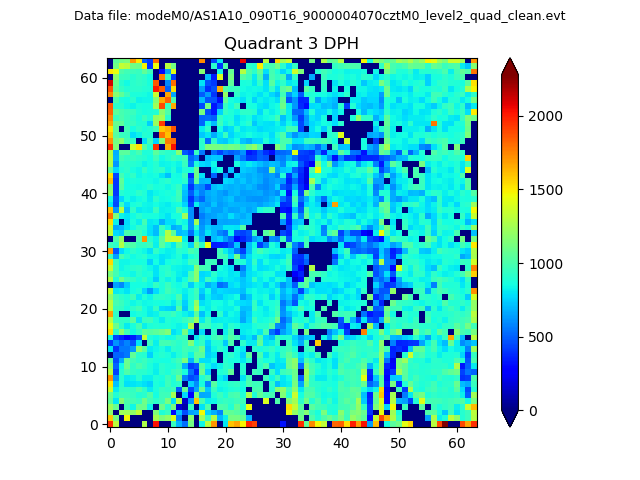 |
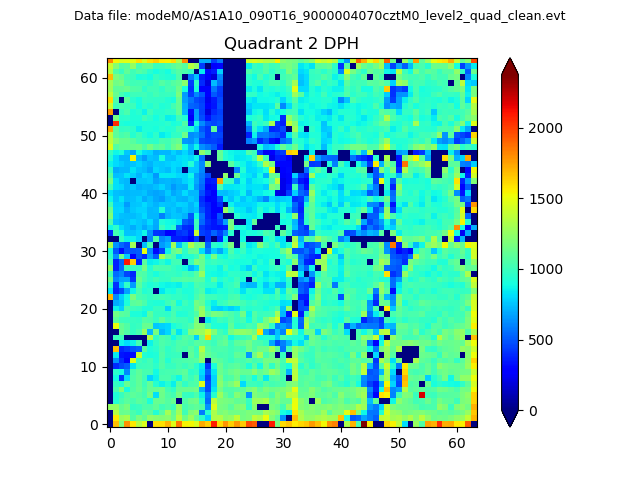 |
Quadrant C |
| Plot type | Count rate plots | Images |
|---|---|---|
| Comparison with Poisson distribution Blue bars denote a histogram of data divided into 1 sec bins. Red curve is a Poisson curve with rate = median count rate of data. |
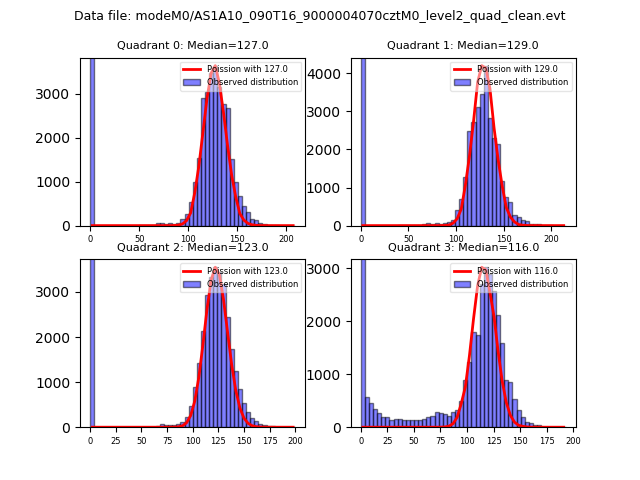 |
 |
| Quadrant-wise count rates Data is divided into 100 sec bins |
 |
|
| Module-wise count rates for Quadrant A Data is divided into 100 sec bins |
 |
 |
| Module-wise count rates for Quadrant B Data is divided into 100 sec bins |
 |
 |
| Module-wise count rates for Quadrant C Data is divided into 100 sec bins |
 |
 |
| Module-wise count rates for Quadrant D Data is divided into 100 sec bins |
 |
 |
| Parameter | Plot |
|---|---|
| CZT HV Monitor |  |
| D_VDD |  |
| Temperature 1 |  |
| Veto HV Monitor |  |
| Veto LLD |  |
| Alpha Counter |  |
| _CPM_Rate |  |
| CZT Counter |  |
| +2.5 Volts monitor |  |
| +5 Volts monitor |  |
| _ROLL_ROT |  |
| _Roll_DEC | 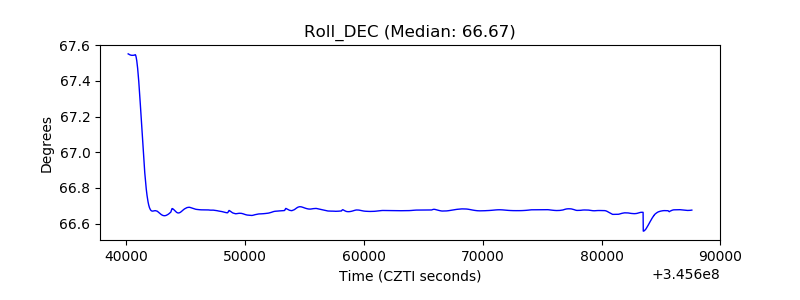 |
| _Roll_RA |  |
| Veto Counter | 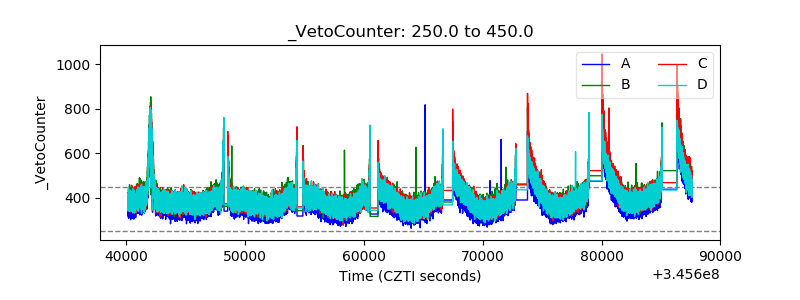 |