| Param | Original file | Final file |
|---|---|---|
| Filename | modeM0/AS1A10_073T05_9000004068cztM0_level2_bc.evt | modeM0/AS1A10_073T05_9000004068cztM0_level2_quad_clean.evt |
| Size (bytes) | 4,853,954,880 | 1,512,187,200 |
| Size | 4.5 GB | 1.4 GB |
| Events in quadrant A | 23,120,686 | 9,967,651 |
| Events in quadrant B | 30,216,847 | 9,877,205 |
| Events in quadrant C | 24,611,644 | 9,469,360 |
| Events in quadrant D | 61,668,831 | 9,051,025 |
| Mode M0 | |||
|---|---|---|---|
| Quadrant | BADHDUFLAG | Total packets | Discarded packets |
| A | 0 | 223398 | 0 |
| B | 0 | 251880 | 0 |
| C | 0 | 234588 | 0 |
| D | 0 | 362667 | 0 |
| Mode SS | |||
|---|---|---|---|
| Quadrant | BADHDUFLAG | Total packets | Discarded packets |
| A | 0 | 2212 | 0 |
| B | 0 | 2210 | 0 |
| C | 0 | 2212 | 0 |
| D | 0 | 2212 | 0 |
| Mode M9 | |||
|---|---|---|---|
| Quadrant | BADHDUFLAG | Total packets | Discarded packets |
| A | 0 | 189 | 0 |
| B | 0 | 189 | 0 |
| C | 0 | 189 | 0 |
| D | 0 | 189 | 0 |
| Quadrant | Total seconds | Saturated seconds | Saturation percentage |
|---|---|---|---|
| A | 108544 | 911 | 0.839291% |
| B | 108532 | 3551 | 3.271846% |
| C | 108533 | 2390 | 2.202095% |
| D | 108525 | 11641 | 10.726561% |
Noise dominated data is calculated using 1-second bins in cleaned event files. If a bin has >2000 counts, and if more than 50% of those come from <1% of pixels, then it is considered to be noise-dominated and hence unusable.
| Quadrant | # 1 sec bins | Bins with >0 counts | Bins with >2000 counts | High rate bins dominated by noise | Noise dominated (total time) | Noise dominated (detector-on time) | Marked lightcurve |
|---|---|---|---|---|---|---|---|
| A | 144427 | 108604 | 0 | 0 | 0.00% | 0.00% |  |
| B | 144427 | 108592 | 378 | 378 | 0.26% | 0.35% | 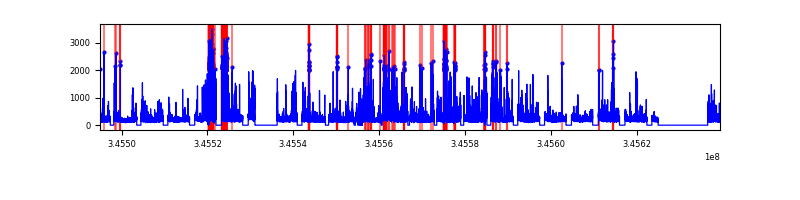 |
| C | 144427 | 108590 | 19 | 19 | 0.01% | 0.02% |  |
| D | 144427 | 108598 | 2898 | 2898 | 2.01% | 2.67% |  |
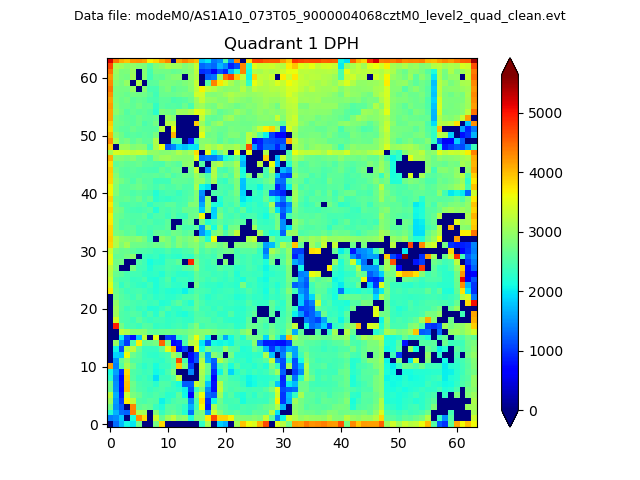
Top three noisy pixels from each quadrant. If the there are fewer than three noisy pixels in the level2.evt file, extra rows are filled as -1
| Pixel properties | Quadrant properties | ||||||
|---|---|---|---|---|---|---|---|
| Quadrant | DetID | PixID | Counts | Sigma | Mean | Median | Sigma |
| A | 13 | 254 | 165021 | 125.51 | 5920 | 5842 | 1268.2 |
| A | 15 | 174 | 78233 | 57.08 | 5920 | 5842 | 1268.2 |
| A | 6 | 16 | 63368 | 45.36 | 5920 | 5842 | 1268.2 |
| B | 10 | 245 | 5943978 | 5412.07 | 5838 | 5705 | 1097.2 |
| B | 10 | 246 | 775231 | 701.34 | 5838 | 5705 | 1097.2 |
| B | 15 | 32 | 591902 | 534.25 | 5838 | 5705 | 1097.2 |
| C | 3 | 233 | 2666592 | 2049.8 | 5552 | 5536 | 1298.2 |
| C | 15 | 208 | 461760 | 351.43 | 5552 | 5536 | 1298.2 |
| C | 2 | 16 | 100022 | 72.78 | 5552 | 5536 | 1298.2 |
| D | 1 | 52 | 21612752 | 17375.77 | 5475 | 5317 | 1243.5 |
| D | 8 | 195 | 4599825 | 3694.71 | 5475 | 5317 | 1243.5 |
| D | 7 | 80 | 4120162 | 3308.98 | 5475 | 5317 | 1243.5 |
Histogram calculated using DETX and DETY for each event in the final _common_clean file
| Quadrant A | 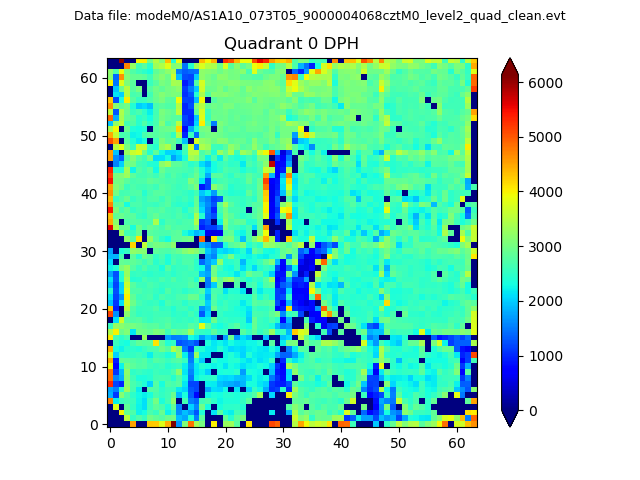 |
 |
Quadrant B |
|---|---|---|---|
| Quadrant D |  |
 |
Quadrant C |
| Plot type | Count rate plots | Images |
|---|---|---|
| Comparison with Poisson distribution Blue bars denote a histogram of data divided into 1 sec bins. Red curve is a Poisson curve with rate = median count rate of data. |
 |
 |
| Quadrant-wise count rates Data is divided into 100 sec bins |
 |
|
| Module-wise count rates for Quadrant A Data is divided into 100 sec bins |
 |
 |
| Module-wise count rates for Quadrant B Data is divided into 100 sec bins |
 |
 |
| Module-wise count rates for Quadrant C Data is divided into 100 sec bins |
 |
 |
| Module-wise count rates for Quadrant D Data is divided into 100 sec bins |
 |
 |
| Parameter | Plot |
|---|---|
| CZT HV Monitor |  |
| D_VDD |  |
| Temperature 1 |  |
| Veto HV Monitor |  |
| Veto LLD |  |
| Alpha Counter |  |
| _CPM_Rate | 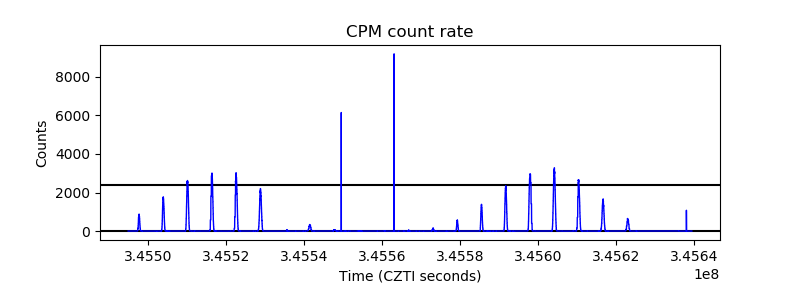 |
| CZT Counter | 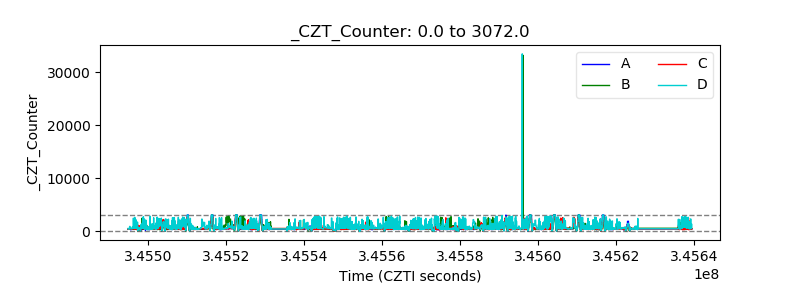 |
| +2.5 Volts monitor |  |
| +5 Volts monitor |  |
| _ROLL_ROT |  |
| _Roll_DEC |  |
| _Roll_RA | 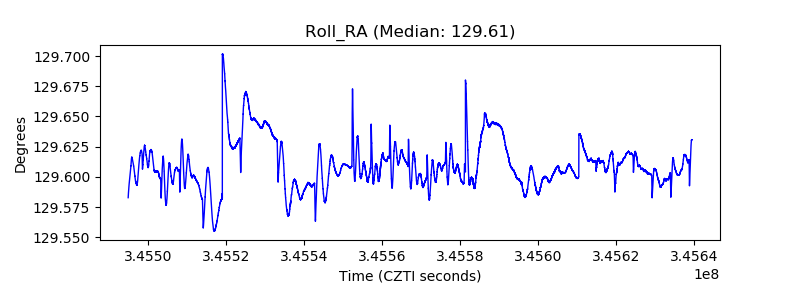 |
| Veto Counter | 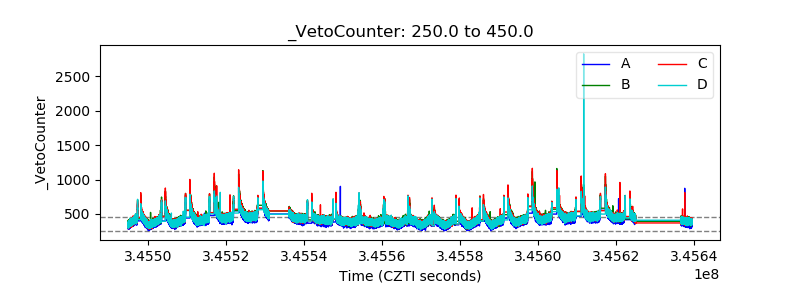 |