| Param | Original file | Final file |
|---|---|---|
| Filename | modeM0/AS1A10_045T04_9000004066cztM0_level2_bc.evt | modeM0/AS1A10_045T04_9000004066cztM0_level2_quad_clean.evt |
| Size (bytes) | 6,622,122,240 | 1,954,598,400 |
| Size | 6.2 GB | 1.8 GB |
| Events in quadrant A | 32,121,445 | 12,623,680 |
| Events in quadrant B | 39,502,341 | 12,816,803 |
| Events in quadrant C | 32,997,548 | 12,240,276 |
| Events in quadrant D | 85,581,160 | 11,098,074 |
| Mode M0 | |||
|---|---|---|---|
| Quadrant | BADHDUFLAG | Total packets | Discarded packets |
| A | 0 | 316032 | 0 |
| B | 0 | 343403 | 0 |
| C | 0 | 324026 | 0 |
| D | 0 | 511288 | 0 |
| Mode M9 | |||
|---|---|---|---|
| Quadrant | BADHDUFLAG | Total packets | Discarded packets |
| A | 0 | 221 | 0 |
| B | 0 | 222 | 0 |
| C | 0 | 222 | 0 |
| D | 0 | 222 | 0 |
| Mode SS | |||
|---|---|---|---|
| Quadrant | BADHDUFLAG | Total packets | Discarded packets |
| A | 0 | 3094 | 0 |
| B | 0 | 3094 | 0 |
| C | 0 | 3094 | 0 |
| D | 0 | 3094 | 0 |
| Quadrant | Total seconds | Saturated seconds | Saturation percentage |
|---|---|---|---|
| A | 152123 | 1945 | 1.278571% |
| B | 152122 | 3887 | 2.555186% |
| C | 152122 | 3254 | 2.139073% |
| D | 152122 | 18250 | 11.996950% |
Noise dominated data is calculated using 1-second bins in cleaned event files. If a bin has >2000 counts, and if more than 50% of those come from <1% of pixels, then it is considered to be noise-dominated and hence unusable.
| Quadrant | # 1 sec bins | Bins with >0 counts | Bins with >2000 counts | High rate bins dominated by noise | Noise dominated (total time) | Noise dominated (detector-on time) | Marked lightcurve |
|---|---|---|---|---|---|---|---|
| A | 198856 | 152115 | 10 | 10 | 0.01% | 0.01% |  |
| B | 198856 | 152113 | 212 | 212 | 0.11% | 0.14% |  |
| C | 198856 | 152115 | 30 | 30 | 0.02% | 0.02% | 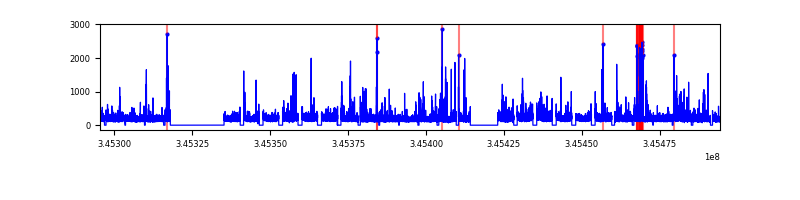 |
| D | 198856 | 152106 | 5172 | 5172 | 2.60% | 3.40% | 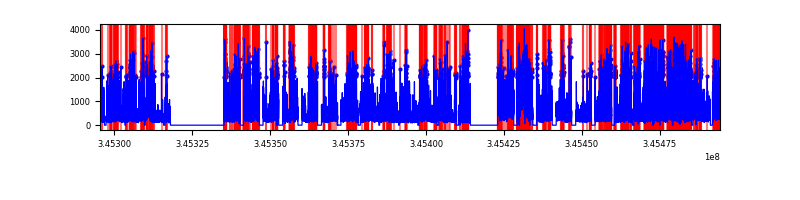 |
Top three noisy pixels from each quadrant. If the there are fewer than three noisy pixels in the level2.evt file, extra rows are filled as -1
| Pixel properties | Quadrant properties | ||||||
|---|---|---|---|---|---|---|---|
| Quadrant | DetID | PixID | Counts | Sigma | Mean | Median | Sigma |
| A | 13 | 254 | 238095 | 131.32 | 8205 | 8069 | 1751.6 |
| A | 0 | 13 | 164899 | 89.53 | 8205 | 8069 | 1751.6 |
| A | 4 | 2 | 108974 | 57.61 | 8205 | 8069 | 1751.6 |
| B | 10 | 245 | 5248766 | 3393.46 | 8257 | 8049 | 1544.4 |
| B | 15 | 32 | 1271836 | 818.32 | 8257 | 8049 | 1544.4 |
| B | 10 | 246 | 521497 | 332.47 | 8257 | 8049 | 1544.4 |
| C | 3 | 233 | 1941959 | 1051.45 | 7875 | 7845 | 1839.5 |
| C | 2 | 16 | 624094 | 335.01 | 7875 | 7845 | 1839.5 |
| C | 15 | 208 | 126195 | 64.34 | 7875 | 7845 | 1839.5 |
| D | 1 | 52 | 27728099 | 15933.15 | 7556 | 7309 | 1739.8 |
| D | 7 | 223 | 7973675 | 4578.85 | 7556 | 7309 | 1739.8 |
| D | 7 | 80 | 6739621 | 3869.55 | 7556 | 7309 | 1739.8 |
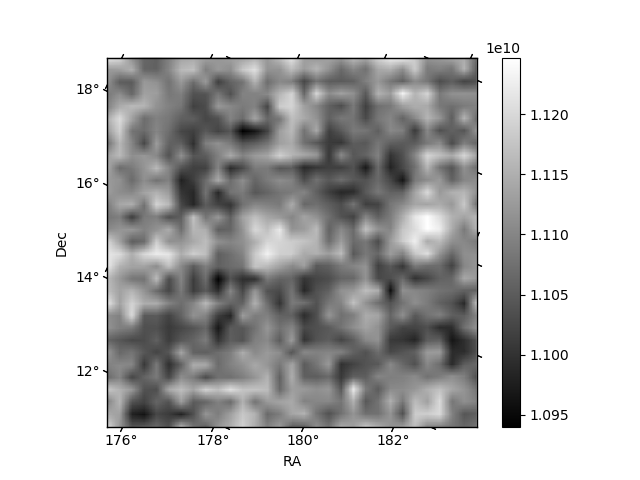
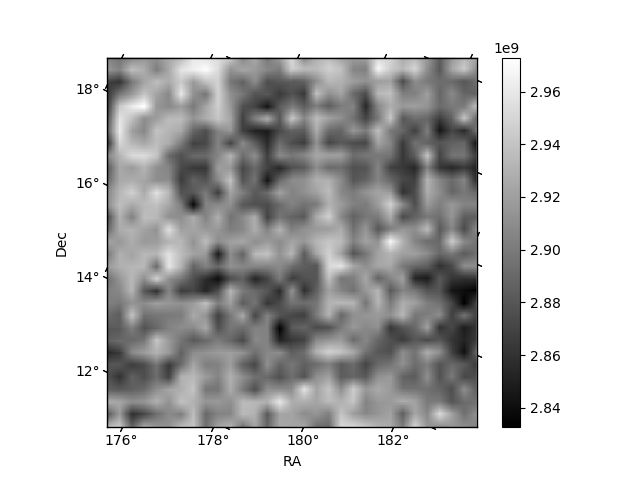
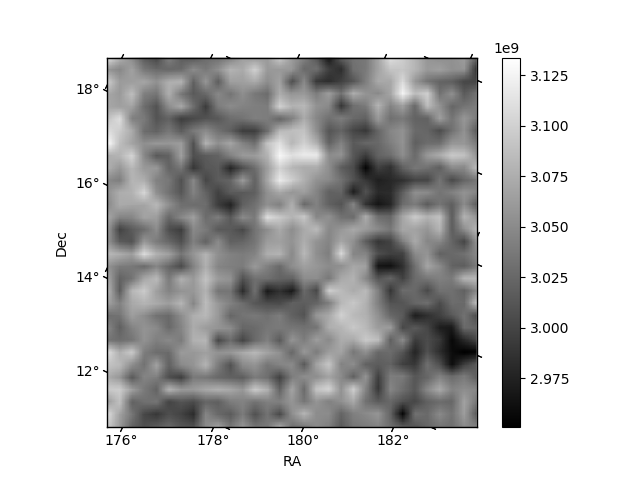
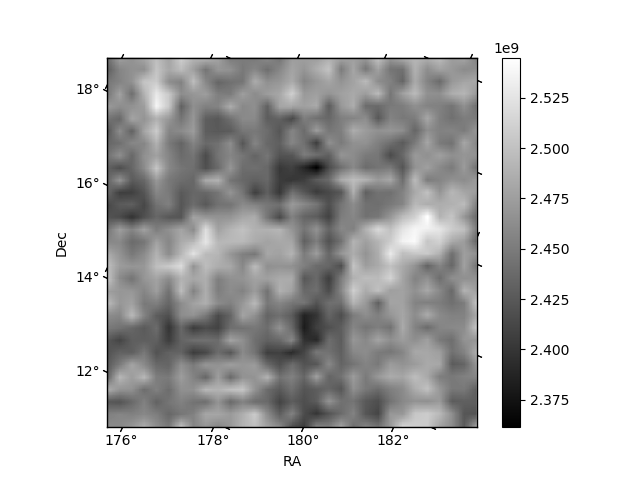
Histogram calculated using DETX and DETY for each event in the final _common_clean file
| Quadrant A | 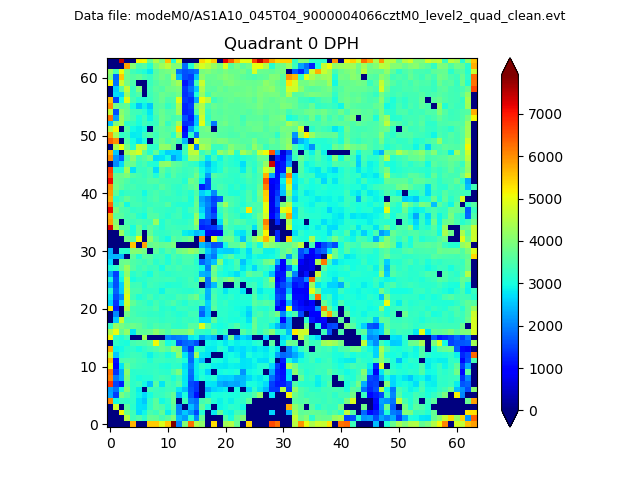 |
 |
Quadrant B |
|---|---|---|---|
| Quadrant D |  |
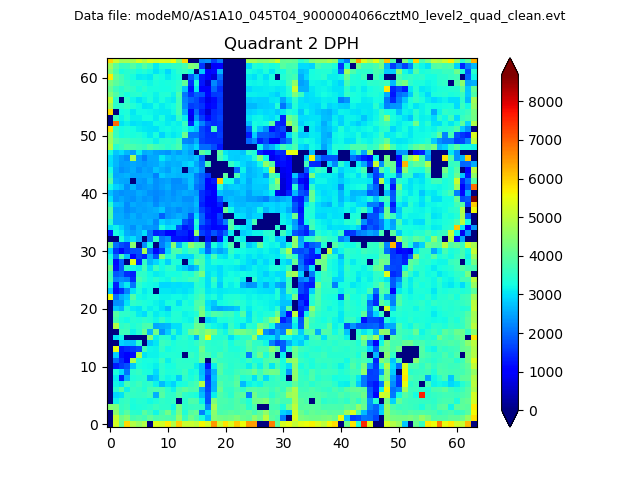 |
Quadrant C |
| Plot type | Count rate plots | Images |
|---|---|---|
| Comparison with Poisson distribution Blue bars denote a histogram of data divided into 1 sec bins. Red curve is a Poisson curve with rate = median count rate of data. |
 |
 |
| Quadrant-wise count rates Data is divided into 100 sec bins |
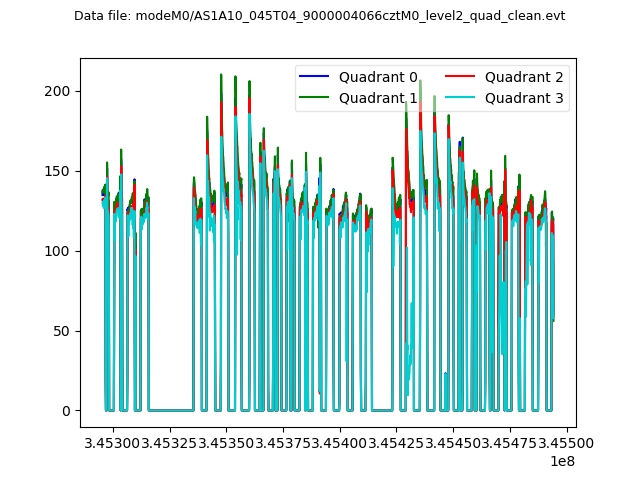 |
|
| Module-wise count rates for Quadrant A Data is divided into 100 sec bins |
 |
 |
| Module-wise count rates for Quadrant B Data is divided into 100 sec bins |
 |
 |
| Module-wise count rates for Quadrant C Data is divided into 100 sec bins |
 |
 |
| Module-wise count rates for Quadrant D Data is divided into 100 sec bins |
 |
 |
| Parameter | Plot |
|---|---|
| CZT HV Monitor |  |
| D_VDD |  |
| Temperature 1 |  |
| Veto HV Monitor |  |
| Veto LLD |  |
| Alpha Counter |  |
| _CPM_Rate |  |
| CZT Counter |  |
| +2.5 Volts monitor |  |
| +5 Volts monitor |  |
| _ROLL_ROT |  |
| _Roll_DEC |  |
| _Roll_RA | 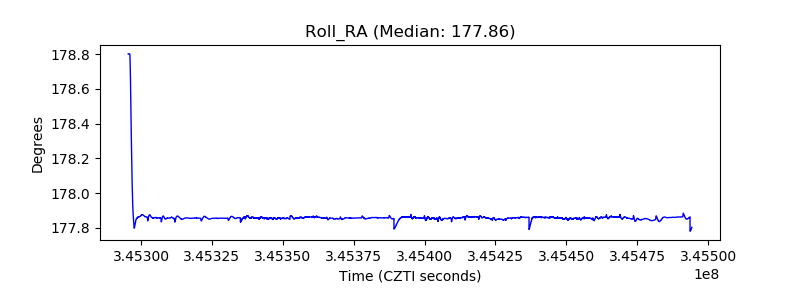 |
| Veto Counter |  |