| Param | Original file | Final file |
|---|---|---|
| Filename | modeM0/AS1A10_024T01_9000004062cztM0_level2_bc.evt | modeM0/AS1A10_024T01_9000004062cztM0_level2_quad_clean.evt |
| Size (bytes) | 1,088,680,320 | 344,413,440 |
| Size | 1.0 GB | 328.5 MB |
| Events in quadrant A | 5,175,022 | 2,250,460 |
| Events in quadrant B | 6,275,614 | 2,244,521 |
| Events in quadrant C | 5,115,084 | 2,156,666 |
| Events in quadrant D | 14,676,335 | 2,038,046 |
| Mode SS | |||
|---|---|---|---|
| Quadrant | BADHDUFLAG | Total packets | Discarded packets |
| A | 0 | 520 | 0 |
| B | 0 | 520 | 0 |
| C | 0 | 520 | 0 |
| D | 0 | 520 | 0 |
| Mode M9 | |||
|---|---|---|---|
| Quadrant | BADHDUFLAG | Total packets | Discarded packets |
| A | 0 | 23 | 0 |
| B | 0 | 23 | 0 |
| C | 0 | 23 | 0 |
| D | 0 | 23 | 0 |
| Mode M0 | |||
|---|---|---|---|
| Quadrant | BADHDUFLAG | Total packets | Discarded packets |
| A | 0 | 52350 | 0 |
| B | 0 | 56070 | 0 |
| C | 0 | 53128 | 0 |
| D | 0 | 83778 | 0 |
| Quadrant | Total seconds | Saturated seconds | Saturation percentage |
|---|---|---|---|
| A | 25324 | 277 | 1.093824% |
| B | 25324 | 412 | 1.626915% |
| C | 25324 | 427 | 1.686148% |
| D | 25324 | 1622 | 6.404991% |
Noise dominated data is calculated using 1-second bins in cleaned event files. If a bin has >2000 counts, and if more than 50% of those come from <1% of pixels, then it is considered to be noise-dominated and hence unusable.
| Quadrant | # 1 sec bins | Bins with >0 counts | Bins with >2000 counts | High rate bins dominated by noise | Noise dominated (total time) | Noise dominated (detector-on time) | Marked lightcurve |
|---|---|---|---|---|---|---|---|
| A | 27649 | 25323 | 0 | 0 | 0.00% | 0.00% |  |
| B | 27649 | 25324 | 0 | 0 | 0.00% | 0.00% |  |
| C | 27649 | 25325 | 4 | 4 | 0.01% | 0.02% |  |
| D | 27649 | 25324 | 509 | 509 | 1.84% | 2.01% |  |
Top three noisy pixels from each quadrant. If the there are fewer than three noisy pixels in the level2.evt file, extra rows are filled as -1
| Pixel properties | Quadrant properties | ||||||
|---|---|---|---|---|---|---|---|
| Quadrant | DetID | PixID | Counts | Sigma | Mean | Median | Sigma |
| A | 13 | 254 | 40975 | 135.86 | 1315 | 1289 | 292.1 |
| A | 5 | 203 | 25436 | 82.66 | 1315 | 1289 | 292.1 |
| A | 15 | 174 | 22377 | 72.19 | 1315 | 1289 | 292.1 |
| B | 10 | 245 | 526220 | 2086.9 | 1310 | 1281 | 251.5 |
| B | 0 | 190 | 106924 | 419.99 | 1310 | 1281 | 251.5 |
| B | 4 | 200 | 102027 | 400.52 | 1310 | 1281 | 251.5 |
| C | 2 | 16 | 160771 | 538.54 | 1248 | 1240 | 296.2 |
| C | 3 | 233 | 137231 | 459.07 | 1248 | 1240 | 296.2 |
| C | 15 | 208 | 14125 | 43.5 | 1248 | 1240 | 296.2 |
| D | 1 | 52 | 4467351 | 15265.65 | 1250 | 1206 | 292.6 |
| D | 7 | 223 | 2505625 | 8560.31 | 1250 | 1206 | 292.6 |
| D | 8 | 195 | 871693 | 2975.4 | 1250 | 1206 | 292.6 |
Histogram calculated using DETX and DETY for each event in the final _common_clean file
| Quadrant A |  |
 |
Quadrant B |
|---|---|---|---|
| Quadrant D |  |
 |
Quadrant C |
| Plot type | Count rate plots | Images |
|---|---|---|
| Comparison with Poisson distribution Blue bars denote a histogram of data divided into 1 sec bins. Red curve is a Poisson curve with rate = median count rate of data. |
 |
 |
| Quadrant-wise count rates Data is divided into 100 sec bins |
 |
|
| Module-wise count rates for Quadrant A Data is divided into 100 sec bins |
 |
 |
| Module-wise count rates for Quadrant B Data is divided into 100 sec bins |
 |
 |
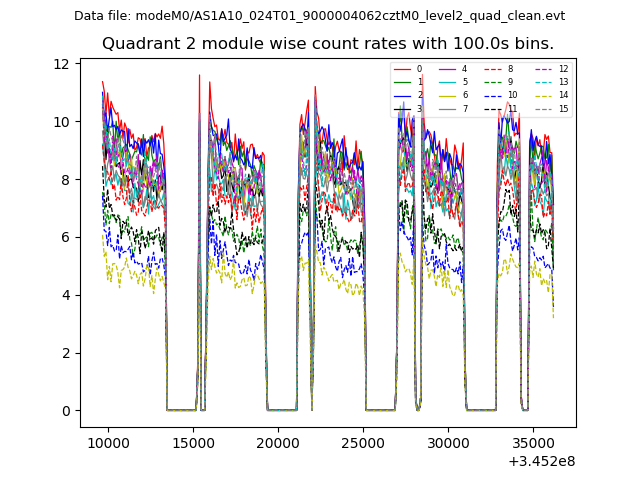
| Module-wise count rates for Quadrant C Data is divided into 100 sec bins |
 |
 |
| Module-wise count rates for Quadrant D Data is divided into 100 sec bins |
 |
 |
| Parameter | Plot |
|---|---|
| CZT HV Monitor |  |
| D_VDD |  |
| Temperature 1 |  |
| Veto HV Monitor |  |
| Veto LLD |  |
| Alpha Counter |  |
| _CPM_Rate |  |
| CZT Counter |  |
| +2.5 Volts monitor |  |
| +5 Volts monitor |  |
| _ROLL_ROT |  |
| _Roll_DEC |  |
| _Roll_RA | 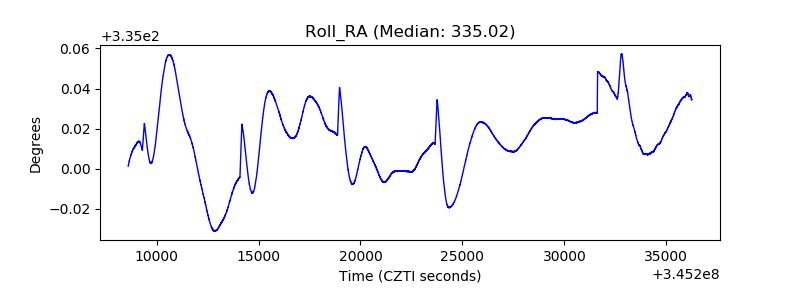 |
| Veto Counter |  |