| Param | Original file | Final file |
|---|---|---|
| Filename | modeM0/AS1A10_057T05_9000004060cztM0_level2_bc.evt | modeM0/AS1A10_057T05_9000004060cztM0_level2_quad_clean.evt |
| Size (bytes) | 2,949,508,800 | 993,139,200 |
| Size | 2.7 GB | 947.1 MB |
| Events in quadrant A | 16,644,536 | 6,532,504 |
| Events in quadrant B | 16,005,016 | 6,450,382 |
| Events in quadrant C | 16,530,319 | 6,151,524 |
| Events in quadrant D | 35,195,471 | 5,964,344 |
| Mode SS | |||
|---|---|---|---|
| Quadrant | BADHDUFLAG | Total packets | Discarded packets |
| A | 0 | 1476 | 0 |
| B | 0 | 1474 | 0 |
| C | 0 | 1474 | 0 |
| D | 0 | 1474 | 0 |
| Mode M0 | |||
|---|---|---|---|
| Quadrant | BADHDUFLAG | Total packets | Discarded packets |
| A | 0 | 153088 | 0 |
| B | 0 | 152191 | 0 |
| C | 0 | 156278 | 0 |
| D | 0 | 232066 | 0 |
| Mode M9 | |||
|---|---|---|---|
| Quadrant | BADHDUFLAG | Total packets | Discarded packets |
| A | 0 | 168 | 0 |
| B | 0 | 168 | 0 |
| C | 0 | 169 | 0 |
| D | 0 | 169 | 0 |
| Quadrant | Total seconds | Saturated seconds | Saturation percentage |
|---|---|---|---|
| A | 72713 | 758 | 1.042455% |
| B | 72683 | 912 | 1.254764% |
| C | 72708 | 1403 | 1.929636% |
| D | 72636 | 7123 | 9.806432% |
Noise dominated data is calculated using 1-second bins in cleaned event files. If a bin has >2000 counts, and if more than 50% of those come from <1% of pixels, then it is considered to be noise-dominated and hence unusable.
| Quadrant | # 1 sec bins | Bins with >0 counts | Bins with >2000 counts | High rate bins dominated by noise | Noise dominated (total time) | Noise dominated (detector-on time) | Marked lightcurve |
|---|---|---|---|---|---|---|---|
| A | 95759 | 72812 | 0 | 0 | 0.00% | 0.00% |  |
| B | 95758 | 72781 | 4 | 4 | 0.00% | 0.01% |  |
| C | 95757 | 72797 | 17 | 17 | 0.02% | 0.02% | 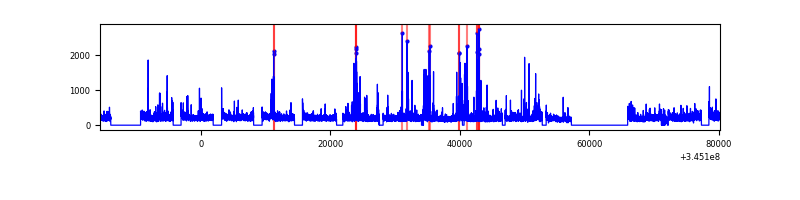 |
| D | 95757 | 72735 | 560 | 560 | 0.58% | 0.77% |  |
Top three noisy pixels from each quadrant. If the there are fewer than three noisy pixels in the level2.evt file, extra rows are filled as -1
| Pixel properties | Quadrant properties | ||||||
|---|---|---|---|---|---|---|---|
| Quadrant | DetID | PixID | Counts | Sigma | Mean | Median | Sigma |
| A | 5 | 98 | 353310 | 398.89 | 4110 | 4050 | 875.6 |
| A | 0 | 13 | 309608 | 348.98 | 4110 | 4050 | 875.6 |
| A | 13 | 254 | 117311 | 129.35 | 4110 | 4050 | 875.6 |
| B | 0 | 230 | 156540 | 201.12 | 4046 | 3951 | 758.7 |
| B | 5 | 255 | 77278 | 96.65 | 4046 | 3951 | 758.7 |
| B | 0 | 183 | 72704 | 90.62 | 4046 | 3951 | 758.7 |
| C | 3 | 233 | 802200 | 889.63 | 3850 | 3842 | 897.4 |
| C | 15 | 208 | 755426 | 837.51 | 3850 | 3842 | 897.4 |
| C | 2 | 16 | 166826 | 181.62 | 3850 | 3842 | 897.4 |
| D | 8 | 195 | 5964322 | 6908.9 | 3783 | 3669 | 862.7 |
| D | 12 | 1 | 5621106 | 6511.09 | 3783 | 3669 | 862.7 |
| D | 1 | 52 | 4903481 | 5679.3 | 3783 | 3669 | 862.7 |
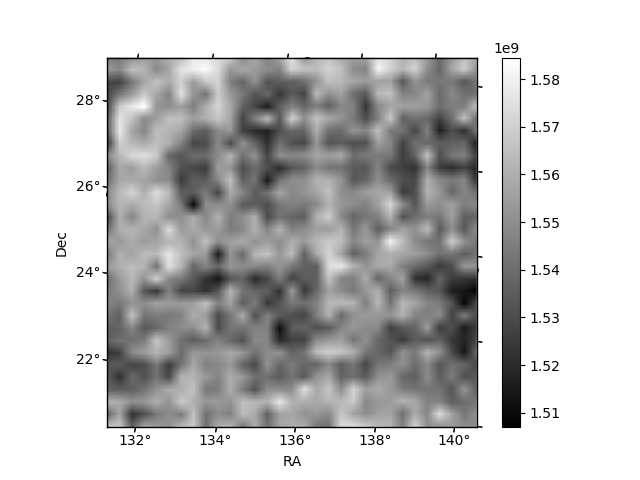
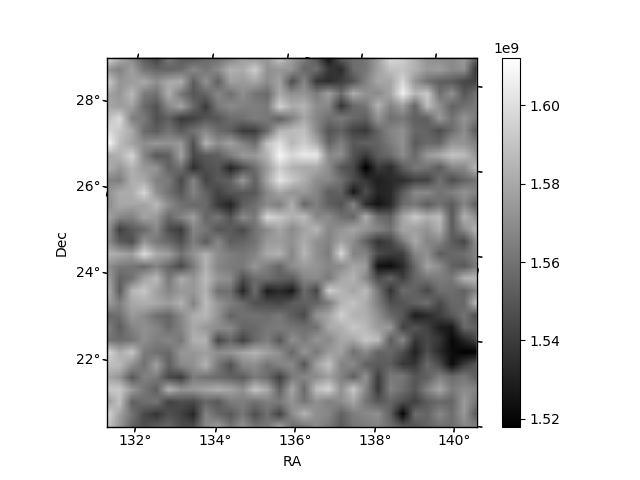
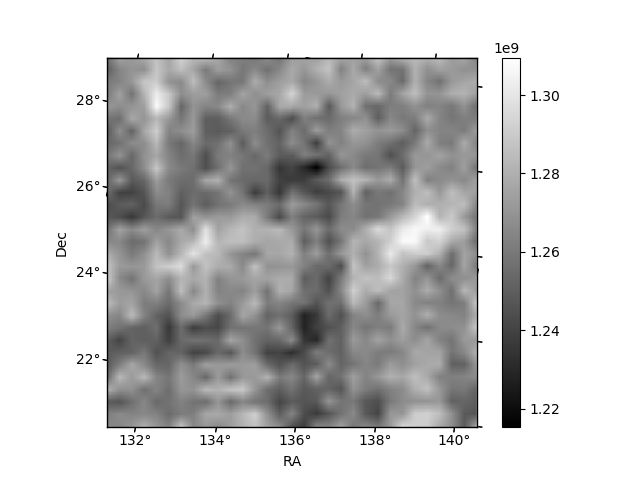
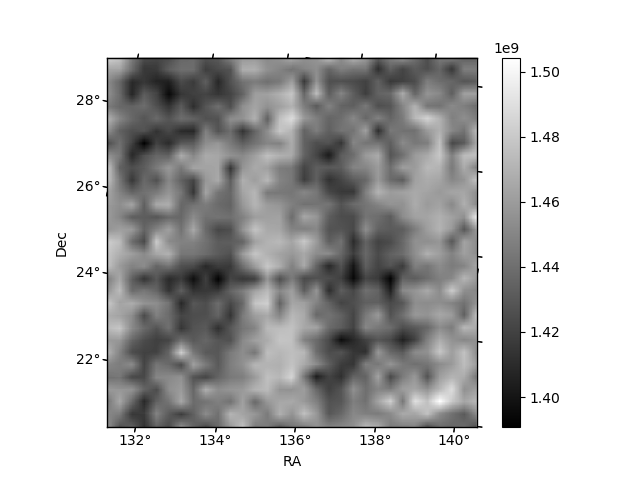
Histogram calculated using DETX and DETY for each event in the final _common_clean file
| Quadrant A |  |
 |
Quadrant B |
|---|---|---|---|
| Quadrant D |  |
 |
Quadrant C |
| Plot type | Count rate plots | Images |
|---|---|---|
| Comparison with Poisson distribution Blue bars denote a histogram of data divided into 1 sec bins. Red curve is a Poisson curve with rate = median count rate of data. |
 |
 |
| Quadrant-wise count rates Data is divided into 100 sec bins |
 |
|
| Module-wise count rates for Quadrant A Data is divided into 100 sec bins |
 |
 |
| Module-wise count rates for Quadrant B Data is divided into 100 sec bins |
 |
 |
| Module-wise count rates for Quadrant C Data is divided into 100 sec bins |
 |
 |
| Module-wise count rates for Quadrant D Data is divided into 100 sec bins |
 |
 |
| Parameter | Plot |
|---|---|
| CZT HV Monitor | 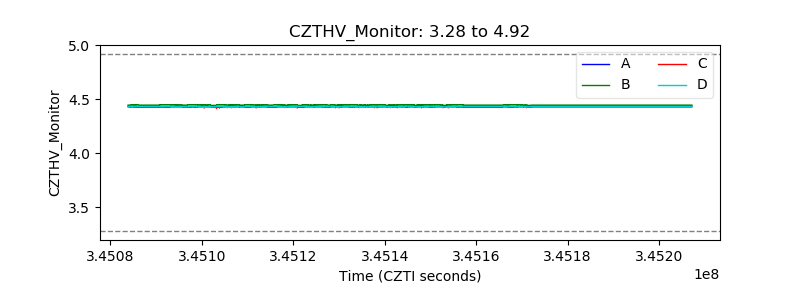 |
| D_VDD |  |
| Temperature 1 |  |
| Veto HV Monitor |  |
| Veto LLD | 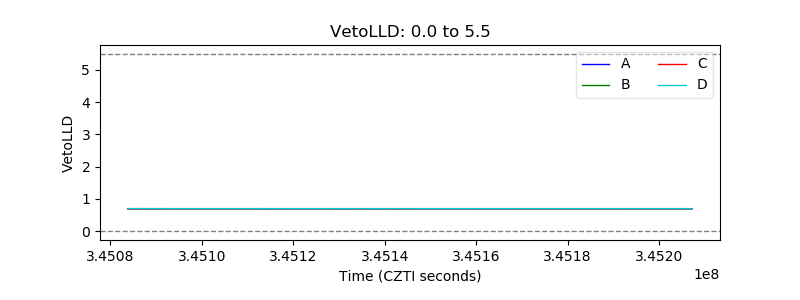 |
| Alpha Counter |  |
| _CPM_Rate |  |
| CZT Counter |  |
| +2.5 Volts monitor |  |
| +5 Volts monitor |  |
| _ROLL_ROT |  |
| _Roll_DEC |  |
| _Roll_RA |  |
| Veto Counter |  |