| Param | Original file | Final file |
|---|---|---|
| Filename | modeM0/AS1A10_073T04_9000004058cztM0_level2_bc.evt | modeM0/AS1A10_073T04_9000004058cztM0_level2_quad_clean.evt |
| Size (bytes) | 577,944,000 | 271,373,760 |
| Size | 551.2 MB | 258.8 MB |
| Events in quadrant A | 2,994,340 | 1,870,915 |
| Events in quadrant B | 2,927,454 | 1,875,881 |
| Events in quadrant C | 3,484,035 | 1,796,277 |
| Events in quadrant D | 7,088,726 | 1,661,843 |
| Mode SS | |||
|---|---|---|---|
| Quadrant | BADHDUFLAG | Total packets | Discarded packets |
| A | 0 | 298 | 0 |
| B | 0 | 298 | 0 |
| C | 0 | 298 | 0 |
| D | 0 | 298 | 0 |
| Mode M0 | |||
|---|---|---|---|
| Quadrant | BADHDUFLAG | Total packets | Discarded packets |
| A | 0 | 30079 | 0 |
| B | 0 | 30035 | 0 |
| C | 0 | 31846 | 0 |
| D | 0 | 46600 | 0 |
| Mode M9 | |||
|---|---|---|---|
| Quadrant | BADHDUFLAG | Total packets | Discarded packets |
| A | 0 | 16 | 0 |
| B | 0 | 16 | 0 |
| C | 0 | 16 | 0 |
| D | 0 | 16 | 0 |
| Quadrant | Total seconds | Saturated seconds | Saturation percentage |
|---|---|---|---|
| A | 14702 | 75 | 0.510135% |
| B | 14702 | 36 | 0.244865% |
| C | 14702 | 169 | 1.149503% |
| D | 14702 | 1635 | 11.120936% |
Noise dominated data is calculated using 1-second bins in cleaned event files. If a bin has >2000 counts, and if more than 50% of those come from <1% of pixels, then it is considered to be noise-dominated and hence unusable.
| Quadrant | # 1 sec bins | Bins with >0 counts | Bins with >2000 counts | High rate bins dominated by noise | Noise dominated (total time) | Noise dominated (detector-on time) | Marked lightcurve |
|---|---|---|---|---|---|---|---|
| A | 16232 | 14702 | 13 | 13 | 0.08% | 0.09% | 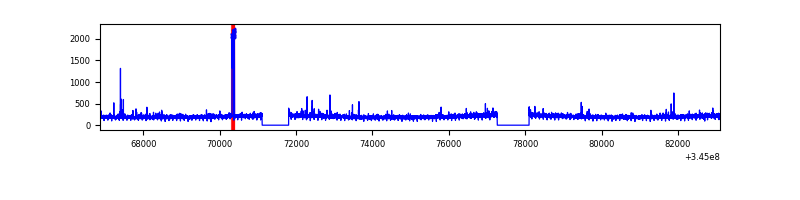 |
| B | 16232 | 14702 | 0 | 0 | 0.00% | 0.00% |  |
| C | 16232 | 14702 | 1 | 1 | 0.01% | 0.01% | 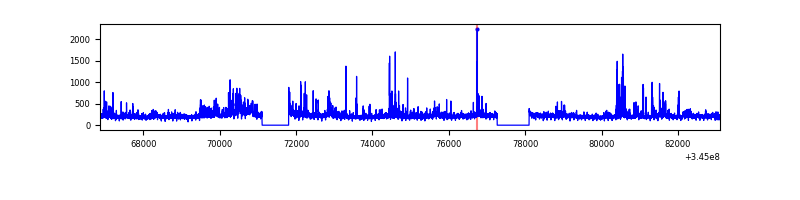 |
| D | 16232 | 14698 | 113 | 113 | 0.70% | 0.77% |  |
Top three noisy pixels from each quadrant. If the there are fewer than three noisy pixels in the level2.evt file, extra rows are filled as -1
| Pixel properties | Quadrant properties | ||||||
|---|---|---|---|---|---|---|---|
| Quadrant | DetID | PixID | Counts | Sigma | Mean | Median | Sigma |
| A | 13 | 170 | 78293 | 467.61 | 745 | 732 | 165.9 |
| A | 13 | 254 | 22748 | 132.73 | 745 | 732 | 165.9 |
| A | 0 | 13 | 22649 | 132.14 | 745 | 732 | 165.9 |
| B | 0 | 230 | 20777 | 139.3 | 744 | 728 | 143.9 |
| B | 4 | 52 | 14180 | 93.47 | 744 | 728 | 143.9 |
| B | 4 | 200 | 14142 | 93.2 | 744 | 728 | 143.9 |
| C | 3 | 233 | 637202 | 3687.05 | 712 | 709 | 172.6 |
| C | 15 | 208 | 109125 | 628.03 | 712 | 709 | 172.6 |
| C | 13 | 61 | 4143 | 19.89 | 712 | 709 | 172.6 |
| D | 12 | 1 | 1516897 | 9351.98 | 689 | 667 | 162.1 |
| D | 8 | 195 | 1180868 | 7279.38 | 689 | 667 | 162.1 |
| D | 1 | 52 | 631491 | 3890.87 | 689 | 667 | 162.1 |
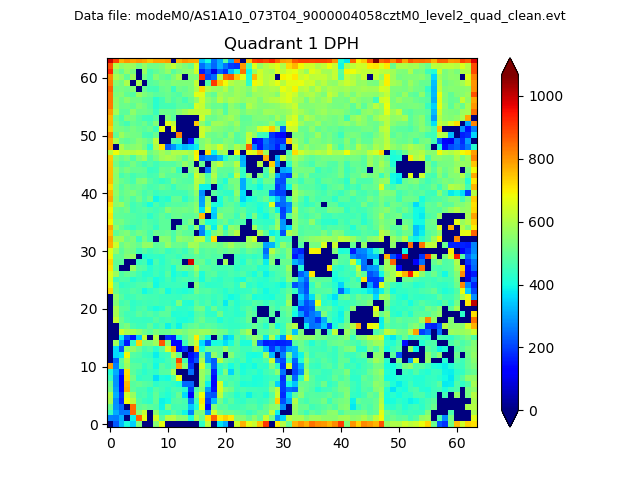
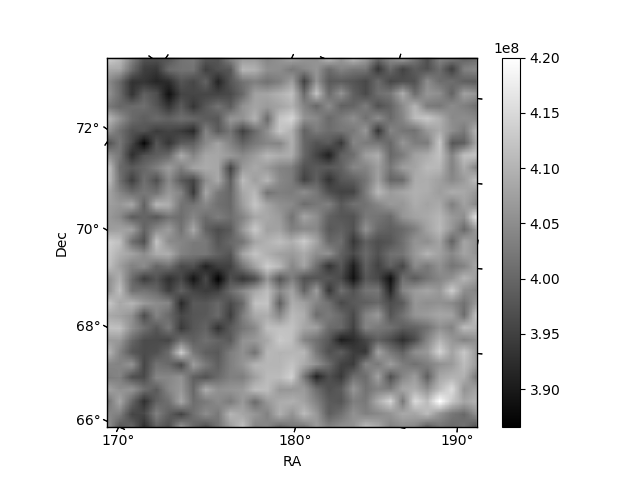
Histogram calculated using DETX and DETY for each event in the final _common_clean file
| Quadrant A |  |
 |
Quadrant B |
|---|---|---|---|
| Quadrant D |  |
 |
Quadrant C |
| Plot type | Count rate plots | Images |
|---|---|---|
| Comparison with Poisson distribution Blue bars denote a histogram of data divided into 1 sec bins. Red curve is a Poisson curve with rate = median count rate of data. |
 |
 |
| Quadrant-wise count rates Data is divided into 100 sec bins |
 |
|
| Module-wise count rates for Quadrant A Data is divided into 100 sec bins |
 |
 |
| Module-wise count rates for Quadrant B Data is divided into 100 sec bins |
 |
 |
| Module-wise count rates for Quadrant C Data is divided into 100 sec bins |
 |
 |
| Module-wise count rates for Quadrant D Data is divided into 100 sec bins |
 |
 |
| Parameter | Plot |
|---|---|
| CZT HV Monitor |  |
| D_VDD |  |
| Temperature 1 |  |
| Veto HV Monitor |  |
| Veto LLD | 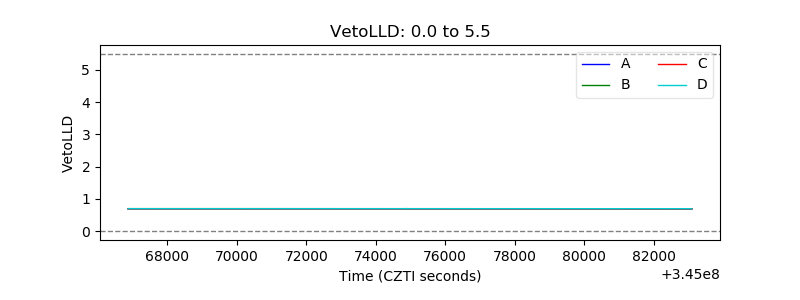 |
| Alpha Counter |  |
| _CPM_Rate |  |
| CZT Counter |  |
| +2.5 Volts monitor |  |
| +5 Volts monitor | 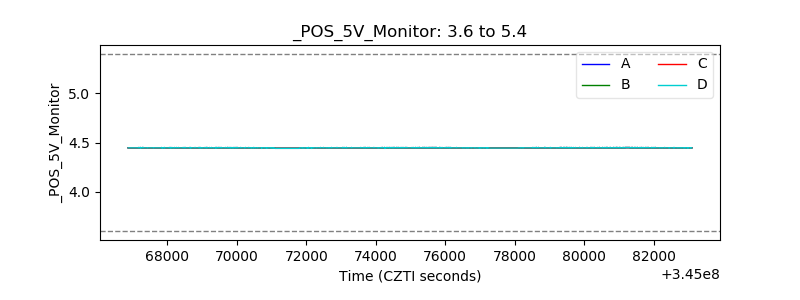 |
| _ROLL_ROT |  |
| _Roll_DEC |  |
| _Roll_RA |  |
| Veto Counter | 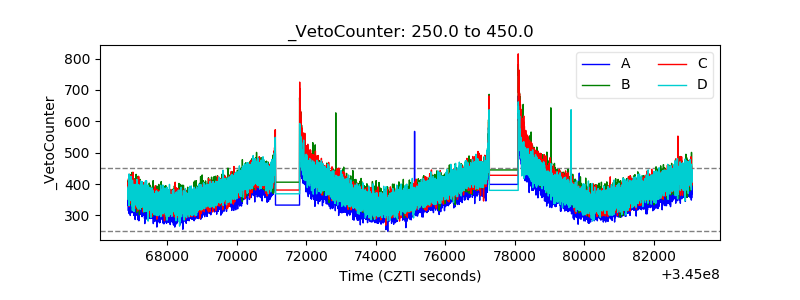 |